TL;DR
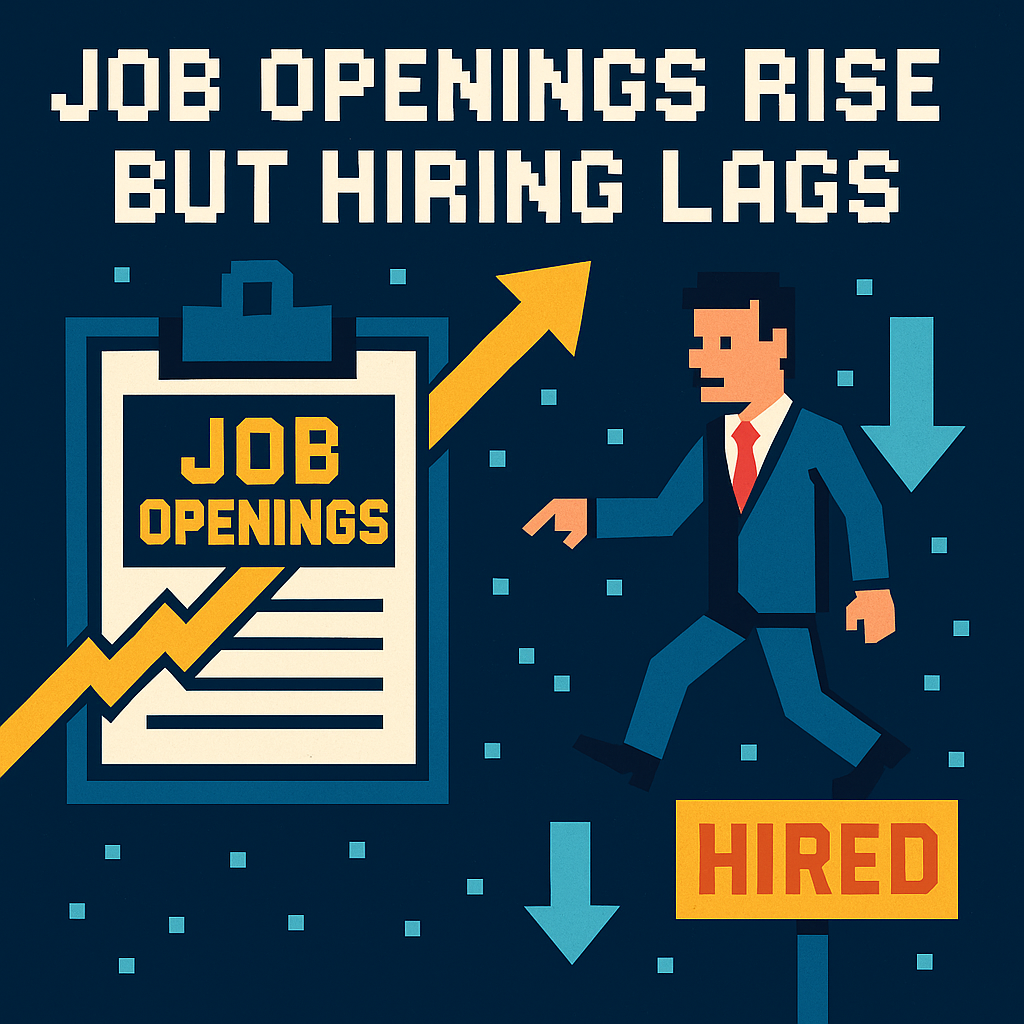
- US job openings jumped to roughly 7.6 million in May 2026 on the BLS JOLTS report, beating forecasts from outlets like CNN and AP and putting the headline labor market back in the spotlight—but it’s a paper tiger if companies still aren’t actually hiring at scale. [1][2][3]
- The power metric isn’t openings; it’s quits. With the quits rate stuck at 1.9% and the Conference Board showing 22.5% of consumers say jobs are “hard to get,” workers aren’t acting like they have bargaining power, which blunts wage-and-inflation fears. [2][6]
- Sector splits matter: construction, manufacturing, and leisure/hospitality raised postings, while finance and information tightened belts—telling CFOs in 2026 to budget for blue-collar scarcity but white-collar slack. [2]
What the source said
CNN reports that US job openings were “much higher than expected” in May 2026, with the JOLTS tally rising for a second straight month to nearly 7.6 million. Economists had anticipated a decline closer to ~7.0 million, but openings instead hovered near a two‑year high. CNN frames the result as evidence the labor market has stabilized despite uncertainty from the Iran war, while also noting layoffs and quits changed little; the layoffs and discharges rate held near 1.0%. The piece highlights differing momentum across industries and argues the “hiring recession” may be ending—albeit tentatively. [1][2]
Why it matters
For the Federal Reserve in Washington, US job openings are a headline indicator that often overstates heat. Monetary policy cares about wages and churn—metrics like a 1.9% quits rate and “modest” wage growth from the Beige Book that actually push prices. A high openings count with flat hires near ~5.2 million and low quits is the definition of “low‑hire, low‑fire,” which pressures neither wages nor inflation. That tilts the 2026 policy debate away from emergency tightening and toward watching three‑to‑six‑month trends. [2][5]
For companies and workers, the distribution is the story. A construction firm in Dallas will feel a tighter market than a fintech in New York. May 2026 JOLTS showed blue‑collar strength (construction, manufacturing, parts of trade) and white‑collar caution (finance, information). That mix determines where signing bonuses return, where ghost postings persist, and who wins the next wage negotiation this year. [2]
Original analysis
Back-of-envelope math
-
Openings-to-unemployed ratio. Openings were 7.594 million in May 2026; the number of unemployed people was about 7.3 million. That pegs the ratio near 1.04 (7.594 ÷ 7.3 ≈ 1.04). Translation: roughly one posted job per job seeker, down from the 1.5–2.0 range at the 2022 peak, but still tighter than 2019’s near‑parity. [2][7][8]
-
The conversion gap. Hires were about 5.18 million in May versus 7.594 million openings, a gap of ~2.41 million postings that did not convert during the month. This isn’t apples‑to‑apples (openings are a stock; hires are a flow), but the gap’s scale helps explain why the quits rate can sit at 1.9% even when openings look lofty. [2][3]
-
If quits normalize. The pre‑pandemic quits rate hovered near 2.3% in 2019; today it’s 1.9%. The delta is 0.4 percentage points (0.023 − 0.019 = 0.004). On a workforce around 160 million, that implies roughly 640,000 additional quits per month if quits returned to the 2019 norm (0.004 × 160,000,000 ≈ 640,000)—material churn that would lift wage pressure; we’re not there. [2][7][8]
A 2×2 for US job openings and hires momentum (May 2026)
-
Rising openings, rising hires (early‑cycle feel)
- Leisure & hospitality: openings +95k (846k → 941k); hires +15k (976k → 991k). Summer travel demand and services spending support this pulse. [2]
- Government (state/local): openings +20k (697k → 717k); hires +21k (302k → 323k). Local services normalized post‑pandemic staffing. [2]
-
Rising openings, falling hires (bottlenecks or cautious conversion)
- Wholesale trade: openings +71k (178k → 249k); hires −20k (141k → 121k). Inventory restocking wants heads, but managers aren’t pulling triggers yet. [2]
-
Falling openings, rising or flat hires (drawdown of backlog)
- Education & health: openings −119k (1,658k → 1,539k); hires +1k (737k → 738k). Health‑care pipelines keep clearing even as postings cool. [2]
- Information: openings −6k (82k → 76k); hires +2k (78k → 80k) is basically flat—still post‑AI digestion mode in 2026. [2]
-
Falling openings, falling hires (real softening)
- Financial activities: openings −29k (405k → 376k); hires −7k (181k → 174k). Margin compression and credit risk discipline curb reqs and fills. [2]
Consensus says “openings beat = tight labor market.” Contrarian read: this is a reposting economy, not a rehiring economy. Hires are stuck near 5.2 million, quits are stuck at 1.9%, and the Fed’s Beige Book keeps calling wage growth “modest.” That triad isn’t inflationary; it’s stasis. [2][5]
What about sentiment? The Conference Board’s June 2026 survey shows the share saying “jobs are hard to get” jumped to 22.5%, the highest since January 2021. If households feel jobs are scarcer, they don’t quit—and if they don’t quit, wage bargaining power stalls. That squares with JOLTS’ 1.9% quits rate and ~5.2 million hires. [2][6]
Geopolitics is the wrinkle. Beige Book districts in 2026 flagged price pressures tied to the Middle East conflict and energy costs, but employment described as “flat to unchanged.” In other words: the war can tax the price level without reigniting labor churn. That’s why the May openings pop coexists with modest wages and still‑constrained hiring. [5]
Named-stakeholder snapshot
-
Federal Reserve: Headline openings buy time but don’t force hikes in 2026. With hires flat near ~5.2 million and quits subdued at 1.9%, wage‑push inflation risk looks contained; the Committee will emphasize trend, not a single data point. [2][5]
-
Blue‑collar employers (D.R. Horton, Caterpillar, Marriott): Brace for tighter local markets as construction, manufacturing, and leisure openings climb in May 2026. Expect spot bonuses and overtime before full‑time net adds. [2]
-
White‑collar employers (JPMorgan, Salesforce, Comcast): Finance and information show cautious demand; use mid‑2026 to upgrade talent quality without overpaying, but avoid ghost postings that damage brand trust. [2]
-
Staffing firms (Robert Half, Adecco): Wholesale trade’s “rising reqs, falling hires” calls for tighter conversion playbooks and clearer comp‑to‑fill timelines in Q3 2026. [2]
What others are missing
Coverage is underweight the “jobs hard to get” surge and what it says about matching quality and trust in 2026. In June, the Conference Board’s share of consumers saying jobs are “hard to get” jumped to 22.5%, a 5½‑year high, even as May JOLTS openings sat at 7.594 million. The specific angle: phantom postings and evergreen reqs create a credibility gap that suppresses quits, which explains why the quits rate stays at 1.9% and why the Beige Book shows “modest” wage growth despite fat postings. If candidates doubt a posting is real or worth the risk, they won’t move; if managers keep reqs evergreen to gauge talent, they won’t convert. That’s why inflation hawks shouldn’t overreact to a single openings print in May 2026. [2][5][6]
What to watch next
-
By the June 2026 JOLTS release expected in early August 2026, the openings‑to‑unemployed ratio will remain between 0.95 and 1.10, confirming a balanced, not boiling, market. [2][7]
-
Through the September 2026 JOLTS (due November 2026), the quits rate will stay at or below 2.0%, keeping wage growth near its current “modest” pace rather than re‑accelerating. [2][5]
-
By the July 2026 JOLTS (due September 2026), wholesale trade openings will retrace from 249k to below 220k, revealing the May spike as inventory noise rather than sustained demand. [2]
My take
Openings got the headline, but hires and quits got the truth: ~5.2 million hires and a 1.9% quits rate in May 2026. This is a stalemate labor market where employers prefer to post and wait rather than hire and train, and workers prefer to stay put rather than jump and risk. That’s not the setup for a wage spiral or a sudden growth bust in 2026. It’s the setup for grind—modest pay gains, selective scarcity, and a lot of “we’re keeping the req open” emails. If you run a business, budget for targeted blue‑collar shortages and white‑collar abundance; if you run the Fed, keep your powder dry and watch churn, not chatter. [2][5][6]
Sources
-
US job openings were much higher than expected in May, shrugging off uncertainty from Iran war — CNN (https://www.cnn.com/2026/06/30/economy/us-jolts-job-openings-layoffs-may) — Starting point: topline JOLTS beat, two‑year‑high framing, and context around uncertainty.
-
Job Openings and Labor Turnover Survey (Latest numbers and May 2026 news release) — U.S. Bureau of Labor Statistics (https://www.bls.gov/jlt/) — Authoritative figures for May 2026: openings 7.594M, hires ~5.2M, separations ~5.1M, quits rate 1.9%; plus industry tables.
-
Job openings stayed at a surprisingly strong 7.6 million in May; U.S. labor market proves resilient — Associated Press (https://apnews.com/article/2947b00cdf3fadacf28c50ad508a6502) — Independent confirmation that openings beat forecasts while hiring remained subdued.
-
May 2026 JOLTS Report: More of the Same — Indeed Hiring Lab (https://www.hiringlab.org/2026/06/30/may-2026-jolts-report-more-of-the-same/) — Analyst take on low quits, flat dynamism, and why postings don’t equal real opportunities.
-
Beige Book (May/June 2026 summaries) — Board of Governors of the Federal Reserve System (https://www.federalreserve.gov/monetarypolicy/beigebook202605-summary.htm) — Fed’s national read: employment largely unchanged and wage growth “modest” amid elevated energy costs.
-
US Consumer Confidence Inched Up in June — The Conference Board (https://www.conference-board.org/topics/consumer-confidence/index.cfm) — “Jobs hard to get” share rose to 22.5% in June 2026, the highest since January 2021.
-
The Employment Situation — May 2026 — U.S. Bureau of Labor Statistics (https://www.bls.gov/news.release/archives/empsit_06052026.pdf) — Unemployment rate at 4.3% with about 7.3 million unemployed; provides the denominator for openings‑to‑unemployed.
-
Job openings, hires, and quits set record highs in 2019 — Monthly Labor Review (BLS) (https://www.bls.gov/opub/mlr/2020/article/job-openings-hires-and-quits-set-record-highs-in-2019.htm) — Background on the 2019 quits norm (~2.3%) for benchmarking 2026’s 1.9% rate.
Related update: We recently published an article that expands on this topic: read the latest post.
Related update: We recently published an article that expands on this topic: read the latest post.