TL;DR
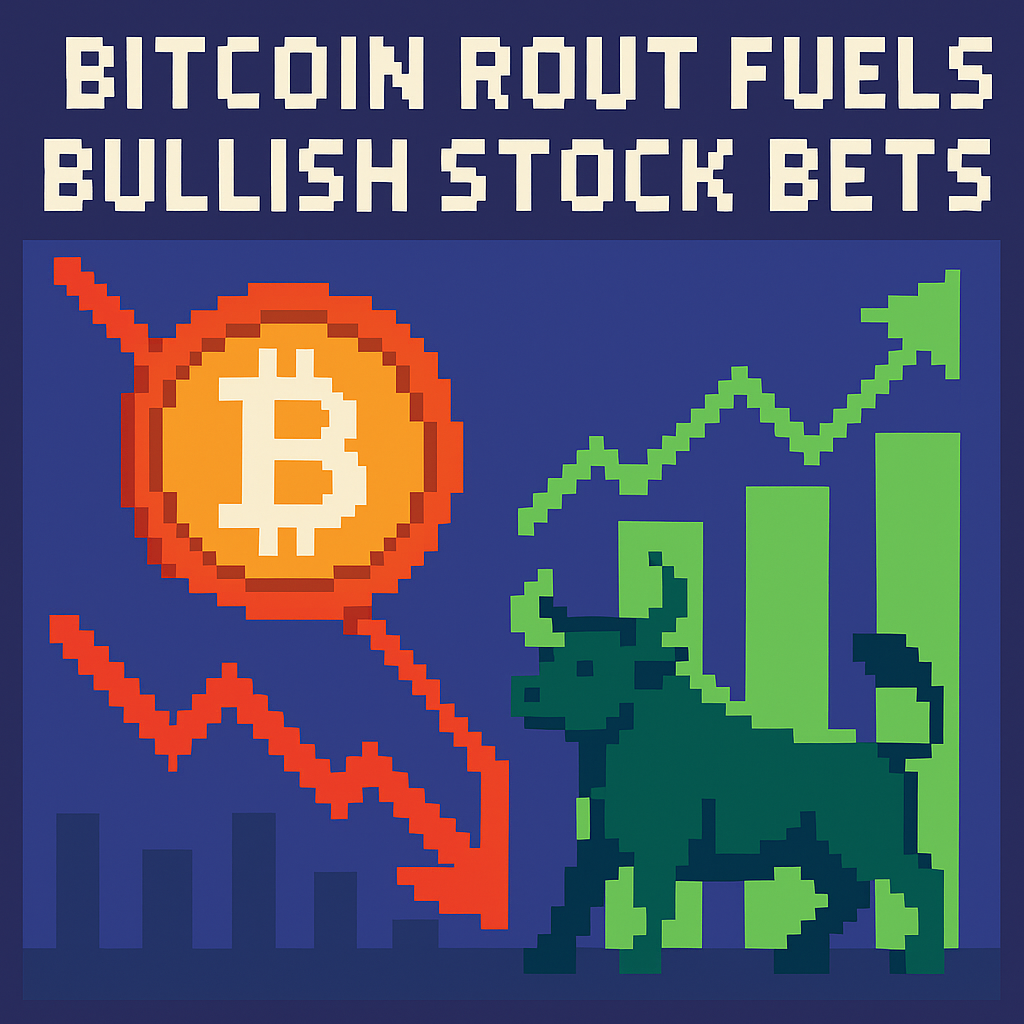
- Bitcoin’s sell-off under $60,000 triggered a rare, record outflow regime in U.S. spot Bitcoin ETFs, while options traders split: a large bearish diagonal in MicroStrategy (MSTR) and a bullish diagonal in Coinbase (COIN). [1][3][4]
- Since late 2024, options on spot Bitcoin ETFs (IBIT, FBTC, ARKB) have let dealer hedging amplify spot moves via creations/redemptions feedback loops. [5][6]
- Miners are a hidden pressure point: CoinShares’ weighted average cash cost neared ~$79,995 per BTC post‑halving, so sub‑$65k spot tightens balance sheets and can force BTC sales or AI pivots. [8]
What the source said
CNBC reported Bitcoin dipped below $60,000 for the first time since October 2024 before rebounding, leaving BTC roughly 27% lower year‑to‑date in 2026 and about 50% off its October 2025 all‑time high near $126,000. Options activity surged: IBIT ranked among the most‑traded tickers as one jumbo diagonal in MicroStrategy collected about $56 million by selling August $125 calls and buying nearer‑dated $180 calls, while another trader spent ~$21 million on a bullish diagonal in Coinbase targeting ~$183.40 by August 21. FundStrat’s Tom Lee cited Bitcoin’s proof‑of‑work resilience as a reason to expect a rebound. [1][2]
Why it matters
-
ETF flows are the marginal driver. U.S. spot Bitcoin ETFs just posted a 13‑session, ~$4.4 billion outflow streak, the longest since their 2024 launches, and that afternoon flow regime now dictates who buys or sells spot each day. Whether those flows flip back to net inflows or extend redemptions will steer whether BTC stabilizes near $60k or revisits deeper drawdowns. [3]
-
Options→ETF→spot plumbing now transmits shocks. Since options began trading on IBIT, FBTC, and ARKB, dealer hedging can transform options exposure into ETF share demand, AP creates/redeems, and then spot prints—especially on thin‑liquidity days around month‑end. If you hold MSTR, COIN, or miners, your P/L partly depends on that 2024‑vintage microstructure. [5][6]
Original analysis
Contrarian read
- Consensus: “ETF outflows prove institutions are leaving—winter is back.”
- My case: The 13‑day outflow streak looks like a microstructure‑driven unwind, not a secular abandonment. It ended with a small $3.05 million net inflow on June 4, and IBIT posted a second‑largest daily outflow of $528 million a week earlier amid a record‑scale block—hallmarks of position clearing and rebalance. Watch flows over the next 4–6 weeks; normalization would frame the sell‑off as a mid‑cycle flush. [3][4]
Back‑of‑envelope math: the Coinbase diagonal
- The flagged trade owns August 21 COIN $160 calls financed by selling June 18 calls; breakeven sits near $183.40, about 13% above Monday’s price. If COIN’s beta to BTC runs >1—as digital‑asset equities often do in volatile regimes—then a 13% COIN pop implies only a ~9–10% BTC lift. With BTC around $61,233 on June 10, the diagonal pays if spot tags roughly $67k by mid‑August—achievable if ETF outflows ease and macro headwinds (rates/dollar) cool. [1][7][10]
- Math: 13% COIN move ÷ 1.3–1.5 beta ≈ 8.7%–10% BTC move; $61,233 × 1.09 ≈ $66,745; × 1.10 ≈ $67,356. [7][10]
Named‑stakeholder breakdown
- MicroStrategy (MSTR): The firm disclosed selling 32 BTC for about $2.5 million between May 26–31—the first sale since 2022—signaling a willingness to tactically raise cash during stress. MSTR’s high equity beta to BTC remains a double‑edged sword for shareholders. [2][9]
- Coinbase (COIN): Reuters reported back‑to‑back quarterly losses into May 2026 as spot volumes cooled, yet elevated implied volatility and options turnover can boost Q3 transaction and derivatives revenues. The August bullish diagonal monetizes rich implieds while targeting a summer bounce above ~$183. [11][1]
- U.S. spot Bitcoin ETFs (IBIT, FBTC, ARKB, GBTC): After ~$4.4B in redemptions over 13 sessions, these wrappers remain the swing factor because listed ETF options invite systematic dealer hedging around strikes and expiries. Watch IBIT option open interest into month‑end and quarter‑end windows. [3][5][6]
- Miners (Marathon, CleanSpark, Riot): With weighted average cash costs near ~$80k per BTC post‑halving, sub‑$65k spot can compress margins and force equity issuance, BTC reserve sales, or an AI‑compute pivot—each adding fragility to rallies. [8]
Flow × Price 2×2 (what each path implies)
- Inflows + Range ($60k–$75k): Base case for stabilization; COIN outperforms MSTR; miners grind on relief.
- Inflows + Breakdown (<$60k): Unlikely but powerful; flows fight price; snapbacks become violent.
- Outflows + Range: Churn; options‑led rallies fade; diagonal sellers win; miners tread water.
- Outflows + Breakdown: Pain trade; MSTR’s high beta bites; miner balance sheets crack faster; COIN delays improvement despite volatility.
Why this isn’t 2022 redux
- The 2022 crash lacked the ETF‑options pipe; 2026 has it. IBIT options ranked in the top 1% of all options products on day one and ETF options volume grew in OCC’s May 2026 data, while the 13‑session outflow streak paused with a small inflow. That mix looks like hedging and de‑risking rather than cascading insolvencies. If rates and the dollar ease and outflows abate, a reflexive rebound toward ~$67k spot would validate the COIN diagonal without heroics. [3][6][12]
What others are missing
The options‑on‑spot‑ETF feedback loop. Since late 2024, IBIT and its peers have listed options that invite dealer gamma/vega hedging on top of ETF creations/redemptions. On down days with net redemptions, dealers short delta against long puts and short calls, which can align with AP redemptions and push spot lower into the close; on calm days, call‑overwriters recycle premium into buybacks or roll‑ups that support rebounds. IBIT options cracked the top 1% of all products at launch, and OCC’s May 2026 report shows ETF options gaining share—evidence the hedging tail can move the spot dog. Ignore this microstructure and you’ll misread both the violence and the velocity of BTC moves. [6][12][5]
What to watch next
- By July 31, 2026, U.S. spot Bitcoin ETFs record at least one five‑trading‑day streak of net inflows, and BTC settles between $65,000 and $69,999 on at least one daily close during that window.
- By the August 21, 2026 options expiration, Coinbase (COIN) trades at or above $183.00 intraday on Nasdaq, validating the bullish diagonal’s breakeven.
- By September 30, 2026 (Q3 2026 reporting), at least one top‑five U.S. miner by market cap announces a significant asset sale or BTC reserve draw to fund capex or AI expansion—disclosed in a Form 8‑K, earnings release, or call transcript. [8]
My take
This downturn looks like plumbing, not doom: ETF redemptions, options hedging, and miner stress hit together, exaggerating both downside and potential recovery. If I must choose into Labor Day 2026 (September 7), I prefer COIN over MSTR because Coinbase monetizes volatility and volume rebounds, while MicroStrategy’s equity beta and balance‑sheet tactics raise drawdown risk. The test is simple and measurable—two straight weeks of positive ETF flows and BTC tagging $67k–$69k—and the August COIN diagonal pays without requiring a new all‑time high. I see better odds of that tape than a 2022‑style insolvency spiral. [3]
Sources
-
Bitcoin’s brutal sell-off sparks a flurry of trading in related stocks, including one big bullish bet — CNBC (https://www.cnbc.com/2026/06/09/bitcoins-brutal-sell-off-sparks-a-flurry-of-trading-in-related-stocks-including-one-big-bullish-bet.html) — Baseline on the BTC break below $60k and the two large diagonal options trades in MSTR and COIN.
-
Bitcoin Drops Under $60,000—A First Since Late 2024 — Forbes (https://www.forbes.com/sites/tylerroush/2026/06/05/bitcoin-falls-below-60000-erasing-trump-fueled-rally/) — Corroborates the sub‑$60k move and frames the drawdown vs. the October 2025 ATH (~$126k).
-
Bitcoin and Ether ETFs end record multi‑billion outflow streak — CoinDesk (https://www.coindesk.com/markets/2026/06/05/bitcoin-and-ether-etfs-end-record-multi-billion-outflow-streak) — Documents the 13‑session, ~$4.4B outflow streak and the first small inflow that ended it.
-
BlackRock’s IBIT sheds $528 million, second‑largest daily outflow — CoinDesk (https://www.coindesk.com/markets/2026/05/28/blackrock-s-bitcoin-etf-sheds-usd528-million-the-second-largest-daily-outflow-on-record) — Details the IBIT redemption scale and role of block trades.
-
SEC approves options trading for multiple Bitcoin ETFs — ETF.com (https://www.etf.com/sections/news/sec-approves-options-trading-multiple-bitcoin-etfs) — Confirms options launches on IBIT, FBTC, ARKB, enabling the hedging channel.
-
Nasdaq-listed IBIT options end first day in the top 1% of all options products — Nasdaq (https://www.nasdaq.com/newsroom/nasdaq-listed-ibit-options-end-first-day-top-1-all-options-products-traded) — Shows IBIT options attained scale quickly, validating the microstructure point.
-
Bitcoin and gold fall together as rate‑hike bets hit every hedge — CoinDesk (https://www.coindesk.com/markets/2026/06/10/bitcoin-and-gold-fall-together-as-a-rate-hike-bet-hits-every-hedge) — Sets spot context: BTC around $61,233 on June 10 and macro linkages.
-
Bitcoin miners are becoming AI companies and selling their BTC to fund the transition — CoinDesk (https://www.coindesk.com/markets/2026/03/27/bitcoin-miners-are-becoming-ai-companies-and-selling-their-btc-to-fund-the-transition) — Cites CoinShares’ ~$79,995 weighted average cash cost and miner AI pivots.
-
MicroStrategy sold 32 BTC for ~$2.5 million between May 26–31 — CoinDesk (https://www.coindesk.com/markets/2026/06/01/strategy-sold-32-btc-for-usd2-5-million-in-late-may-filing-shows) — Confirms the first disclosed sale since 2022 via SEC filing.
-
Structural persistence of digital‑asset treasury betas — SSRN (https://papers.ssrn.com/sol3/Delivery.cfm/6474638.pdf?abstractid=6474638&mirid=1) — Documents that DAT equities exhibit BTC betas >1, informing the COIN beta math.
-
Coinbase logs second straight quarterly loss as trading momentum fades — Investing.com (Reuters) (https://www.investing.com/news/stock-market-news/coinbase-logs-second-straight-quarterly-loss-as-crypto-trading-momentum-fades-4669831) — Supports the claim that early‑2026 activity softness pinched COIN fundamentals.
-
OCC May 2026 Monthly Volume Data — OCC (https://www.theocc.com/newsroom/views/2026/06-02-may-2026-monthly-volume) — Shows the scale and growth of ETF options volume, underscoring why options hedging matters to ETF microstructure.
Related update: We recently published an article that expands on this topic: read the latest post.

Markets on edge: when politics, AI and technicals collide
The opening hook: Markets don’t move in straight lines — they twitch, spasm and sometimes lurch when politics and technology intersect. This week’s action felt exactly like that: a presidential directive touching an AI firm, hotter-than-expected inflation signals and geopolitical jitters combined to push the major indexes below their 50‑day lines — even as equal‑weight ETFs quietly marched to highs. The result is a market with two faces: leadership concentrated in a handful of mega-cap stocks, while breadth measures show a more constructive tape underneath.
What happened, in plain terms
- A White House move restricting federal use of Anthropic’s AI and related contractor bans rattled investors because it directly ties politics to the AI supply chain and big-cloud platforms. (investors.com)
- At the same time, a hotter producer-price backdrop and rising geopolitical tensions pushed risk appetite lower, tipping the major indexes below important short- to intermediate-term technical levels (the 50‑day moving averages). (investors.com)
- Yet equal‑weight ETFs (which give each S&P 500 stock the same influence) were hitting highs, signaling that more of the market — not just the handful of mega-cap names — was showing strength. That divergence (cap-weighted indices weak, equal-weight strong) is crucial to watch. (investors.com)
Why the divergence matters
- Major-cap concentration: When indexes like the S&P 500 and Nasdaq are buoyed mainly by a few giants, headline readings can mask weakness in the broader market. That’s what cap-weighted indexes do: one or two big winners can hide the rest.
- Equal‑weight ETFs tell a different story: If an equal‑weight S&P ETF is making new highs, more stocks are participating in the advance — a potentially healthier sign than a rally led by five names. Investors often use this as a breadth check. (investors.com)
- Technical thresholds (50‑day lines) matter for short-term momentum: many traders and models treat a close below the 50‑day as a warning flag. Seeing major indexes slip below them while equal‑weight funds rally creates a tactical tug-of-war. (investors.com)
The catalysts behind the move
- Political/AI shock: The Trump administration’s restriction on Anthropic for federal agencies — and related contractor constraints — introduced a direct policy risk to AI vendors and cloud partners. That’s not abstract: it affects large platforms, defense contracting, and the perceived growth runway for AI-oriented businesses. Markets price policy risk quickly. (investors.com)
- Inflation data and macro noise: Elevated producer prices and the risk that tariffs or geopolitical flareups could keep inflation sticky make the Fed’s path less certain and reduce tolerance for valuation extremes, especially in cyclical and interest-rate-sensitive names. (cnbc.com)
- Geopolitics and safe-haven flows: Any uptick in global tensions nudges investors toward defense, commodities and some haven assets — and away from crowded growth trades. That dynamic can accelerate short-term rotation. (investors.com)
Where the real strength is: sector and stock themes
- Memory and AI infrastructure: Semiconductor memory names (Sandisk, Micron, Western Digital) have been bright spots this year, driven by data-center demand for GPUs, memory and AI workloads. Even with headline noise, these parts of the market are benefiting from a secular AI buildout. (investors.com)
- Stocks to watch ahead of earnings: With earnings season and major reports coming (Broadcom, MongoDB were noted examples in the coverage), traders will pick through guidance and order trends for clues around AI capex and cloud demand. Strong results could re-center the narrative on earnings rather than politics. (investors.com)
Tactical investor implications
- Watch breadth, not just the headline index: If equal‑weight ETFs are confirming strength, consider using them as a market-health signal. Narrow, mega-cap-led rallies can roll over quickly if the big names stumble. (investors.com)
- Respect the 50‑day: For many quantitative and discretionary traders, the 50‑day moving average is a key momentum filter. A close below it on the major indexes increases short-term caution. (investors.com)
- Be selective, watch earnings: Political shocks can be headline-driven and temporary. Focus on companies with durable demand tailwinds (AI, memory, industrials with pricing power). Earnings and guidance will separate transient volatility from real trend changes. (investors.com)
Market psychology and the “policy shock” problem
There’s a subtle behavioral point here: policy shocks — especially those that single out specific firms or technologies — carry outsized psychological weight. They create binary uncertainty (can the company keep selling to government clients?) and can catalyze algorithmic selling, sector rotation and cessation of flows into targeted ETFs. That domino effect can momentarily depress technicals even when the fundamental demand story (e.g., AI infrastructure spending) remains intact. (investors.com)
What I’m watching next
- Follow-through in equal‑weight ETFs: If they keep rising while cap‑weighted indexes repair and reclaim 50‑day lines, the risk of a broader, sustainable rally improves. (investors.com)
- Earnings commentary from semiconductor and cloud vendors: Will orders and capex commentary support the memory/AI demand story? Strong guidance could re-center markets on fundamentals. (investors.com)
- Macro prints: Inflation and jobs data remain the backdrop. Hot prints can amplify policy- and geopolitics-driven selloffs; softer prints can give risk assets room to regroup. (cnbc.com)
Quick takeaways for busy readers
- Market mood is mixed: headline indices are below their 50‑day lines, but equal‑weight ETFs are making highs — a meaningful divergence. (investors.com)
- Political moves targeting AI vendors can create outsized short‑term volatility even as the long-term AI investment theme remains intact. (investors.com)
- Focus on breadth, earnings and macro prints to judge whether this is a temporary tremor or a deeper shift. (investors.com)
Final thoughts
Markets are messy by design — they’re where policy, psychology and profit motives meet. This week’s patchwork action shows why investors should look beyond the headline index and pay attention to breadth signals like equal‑weight ETFs. Political headlines can spark fast moves, but durable trends are usually revealed in earnings, revenue guidance and flow patterns. Keep watch on those real-economy data points; they’ll tell you whether the market’s undercurrent is a blip or the start of something bigger.
Sources
Related update: We recently published an article that expands on this topic: read the latest post.
November’s market mood: bright leaders, shaky foundation
Monday’s market tape told a familiar — and a little unsettling — story: the Nasdaq and S&P 500 quietly closed higher, lifted by a handful of AI and mega‑cap tech winners, while more than 300 S&P 500 stocks finished the day in the red. That kind of skew — a few names powering headline gains while many constituents lag — is the market’s current frisson: impressive on the surface, fragile underneath.
What happened (the quick read)
- Major AI‑exposed names and cloud/semiconductor plays rallied and helped the indices eke out gains.
- Stock futures slipped slightly the next session as investors digested valuation chatter, profit‑taking and mixed earnings signals.
- Market breadth remained weak: hundreds of S&P 500 components fell even though the cap‑weighted indexes rose, highlighting concentrated leadership.
Why breadth matters
When a market rally is driven by a narrow group of stocks, the headline numbers can mask risk. A cap‑weighted index like the S&P 500 gives outsized influence to the largest companies, so the top handful of megacaps (the “Magnificent Seven” or similar groups) can lift the index even while most companies decline.
- Narrow leadership raises volatility risk: if one or two leaders stumble, index performance can unwind quickly.
- Weak breadth signals potential for rotation: sectors or mid‑caps that haven’t participated may suddenly correct further or rebound sharply if sentiment shifts.
- Valuation sensitivity grows: when gains concentrate in richly valued AI/tech names, any hint of earnings disappointment, regulatory pressure, or slowing adoption can trigger swift re‑pricing.
The context you should keep in mind
- AI enthusiasm has been a strong theme through 2025: big cloud deals, hyperscaler capex and continued demand for AI chips kept investor attention fixed on a small group of winners.
- Many companies are still reporting solid earnings — a reason some strategists argue the rally isn’t just speculative. But even with good results, the market’s recovery is uneven.
- Macro and policy noise (interest‑rate speculation, data delays from the U.S. government shutdown earlier in November, and geopolitical headlines) adds an extra layer of sensitivity to any cracks in leadership performance.
Market signals to watch this week
- Earnings from big tech, chipmakers and cloud providers — these can either reinforce the narrow rally or expose cracks.
- Breadth indicators: the number of advancing vs. declining S&P 500 stocks, and how many are above their 200‑day moving averages.
- Volatility and flows: VIX moves and ETF flows into/out of mega‑cap tech versus broad market funds can show whether investors are rotating or doubling down.
- Macro prints (jobs, Fed commentary) — still decisive for risk appetite and valuation multiples.
What investors can consider (practical framing)
- Check exposure concentration: make sure your portfolio isn’t unknowingly overloaded with a few mega‑cap tech names.
- Think in scenarios, not certainties: prepare for both continued AI momentum and for a re‑rating if sentiment shifts.
- Revisit risk controls: position sizes and stop rules matter more when leadership is narrow and velocity of moves is high.
- Look for quality breadth opportunities: beaten‑down cyclicals or small‑caps with improving fundamentals may offer better risk/reward if rotation arrives.
A snapshot: the narrative versus the reality
Narrative: “AI is lifting markets — buy the leaders.”
Reality: AI‑related leadership is real and powerful — but it hasn’t broadly lifted the market. That divergence means headline gains can be fragile if those leaders catch a cold.
My take
I find this market simultaneously thrilling and unnerving. The technology and AI stories driving gains are compelling — real revenue, real capex, and real productivity use cases — but markets priced on a handful of outcomes are brittle. For investors, nuance matters more than conviction right now: it’s a time to be thoughtful about concentration, to respect strong themes like AI without letting them blind you to poor breadth, and to balance optimism with risk management.
Sources
Related update: We recently published an article that expands on this topic: read the latest post.