
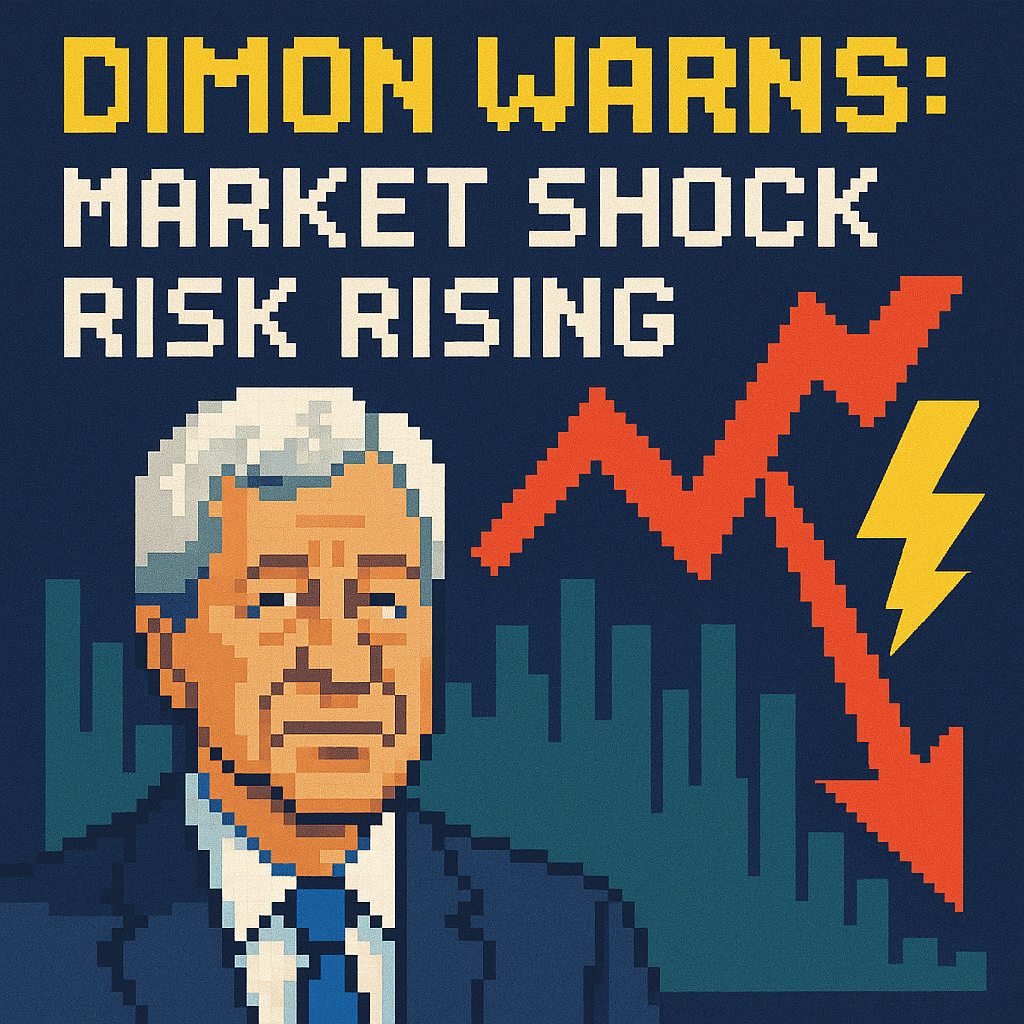
Dimon Warns: Market Shock Risk Rising | Analysis by Brian Moineau

TL;DR

  • Jamie Dimon, JPMorgan’s CEO, has warned since at least the 2023 shareholder letter that higher-for-longer rates, war risk, and fiscal deficits could hit assets; the deeper fuse is U.S. debt rollover colliding with persistent Treasury supply and finite balance sheets. [1][2]
  • Even with June CPI around 3.5% year over year, the 10-year Treasury hovered near 4.6% in mid-July 2026; that level sits well above the government’s current average interest rate on outstanding debt, implying net interest keeps trending higher as low-coupon notes reset. [3][4][5]
  • The 2022 UK gilts shock showed how a long-end spike (30-year yields jumping roughly 130–140 bps in days) can trigger forced selling; the U.S. won’t replay LDI, but heavy funding needs plus convexity and dealer limits can rhyme. [6]

What the source said

In the 2023 JPMorgan shareholder letter, Jamie Dimon flagged persistent inflation, geopolitical conflicts (notably Russia–Ukraine and Middle East hotspots), and fiscal deficits as reasons rates could stay high and markets could see a shock; he argued investors should not assume a smooth disinflation glide path like the mid-1980s. He linked these risks to potential pressure on both equities and bonds if term premia rise and cash flows get discounted at higher rates. He framed bank operating conditions as strong in 2023–2024 but warned they can change quickly if funding costs or credit losses climb. [1]

Why it matters

  • Primary dealers in New York, U.S. money market funds, and foreign reserve managers in places like Tokyo and Beijing finance the Treasury’s deficits, while retirees on Social Security and Medicare, and S&P 500 firms rolling debt, depend on the cost of that funding. If “vigilantes” demand more term premium, the 10-year at roughly 4.55%–4.60% in mid-July 2026 can lift mortgage rates, capex hurdles, and equity discount rates even after a soft CPI headline. [3][4]

  • Traditional 60/40 allocators, banks’ AFS/HTM books, and long-duration ETFs such as iShares TLT (launched 2002) face path risk that inflation prints alone won’t capture; the UK’s 2022 episode showed 30-year gilts spiking about 130–140 bps within days and forcing deleveraging, while TLT itself lost roughly 31% in calendar 2022 during the U.S. rate shock. [6][7]

Original analysis

Dimon’s “shock” setup rests on rates, geopolitics, and deficits. The common reply says: core inflation is easing, so yields drift lower; flare-ups are priced; deficits matter later. I disagree because the plumbing points to supply, rollover, and balance-sheet constraints that act now.

Contrarian read

  • Consensus: Softer CPI = lower yields = duration relief.
  • Counter: Supply and rollover are repricing duration irrespective of CPI. June CPI ran near 3.5% y/y while the 10-year sat around 4.6%, and recent Treasury refunding guidance emphasized steady coupon auction sizes over “at least the next several quarters,” a stance that can buoy term premia when dealer capacity is finite. [3][4][8]

Back-of-envelope calculation (rollover wedge)

  • Facts:
    • Debt held by the public was roughly $29.7 trillion around late 2025, per Treasury’s Debt to the Penny dataset. [9]
    • The weighted average maturity (WAM) of marketable debt was about 70.8 months (≈5.9 years) as of October 31, 2024. [8]
    • The average interest rate on outstanding Treasury marketable debt ran near 3.4% in 2025–2026 per Treasury’s dataset. [5]
    • The 10-year yield in mid-July 2026 printed around 4.55%–4.60%. [4]
  • Mechanics:
    • If WAM ≈ 70.8 months, about 12/70.8 ≈ 17% of the portfolio resets per year.
    • 17% × $29.7T ≈ $5.0T rolling in the next 12 months.
    • Rate gap vs. legacy average cost: 4.60% − 3.40% ≈ 1.20 percentage points.
    • Extra annualized interest from this year’s roll: 1.20% × $5.0T ≈ $60B.
  • Interpretation: That is just year one; as more low-coupon notes roll in 2027–2028, the wedge compounds if the 10-year hangs near 4.6%, regardless of monthly CPI noise. [4][5][9]

Historical analogue: UK gilts, September–October 2022

  • The “mini-budget” shock was not about surprise inflation; it was about sudden term-premium repricing to fund deficits and hedge leverage, with 30-year yields jumping roughly 130–140 bps in a few days, forcing LDI selling and a Bank of England liquidity backstop. The U.S. has deeper markets and no LDI ubiquity, yet persistent supply plus convexity and dealer VAR limits can still pressure the long end quickly. [6]

A simple 2x2: supply vs. risk capacity

  • High supply + thin risk capacity (e.g., big refundings during bank VAR constraints): risk of sharp yield spikes and auction tails.
  • High supply + ample risk capacity (e.g., strong dealer balance sheets and risk-on credit): gradual bear steepening.
  • Low supply + thin risk capacity: choppy range trading with occasional squeezes; term premium can still stay positive.
  • Low supply + ample risk capacity: benign decline in long-end yields; this is the cyclical “soft landing” case and requires deficits to narrow or issuance to skew short.

Named-stakeholder breakdown

  • U.S. Treasury: Recent Quarterly Refunding materials and TBAC slides signal maintaining coupon auction sizes and a stable WAM, which keeps a steady duration pipe flowing into a market where dealers must warehouse risk. [8]
  • JPMorgan, Goldman Sachs, and Bank of America: Trading desks benefit from volatility, but a violent long-end selloff stresses client collateral, increases margin calls, and can dampen primary issuance in New York and London.
  • 60/40 allocators and long-duration ETFs (e.g., TLT): If the 10-year revisits 5% without a growth scare, equity multiples compress while bond NAVs fall—hurting both legs at once; the 2022 TLT drawdown of about −31% shows the convexity bite. [4][7]

One more inconvenient anchor: deficits

  • The CBO’s long-term projections show debt held by the public reaching roughly 116% of GDP by 2034 with primary deficits persisting, implying sustained issuance and a positive term premium absent policy changes; this fiscal backdrop amplifies the rollover wedge described above. [2]

What others are missing

Most coverage centers on “inflation vs. the Fed,” but the under-covered angle is the portfolio’s effective reset speed—call it WANRR, the weighted average next repricing rate. Bills and FRNs shorten the government’s true interest-rate sensitivity; TBAC slides show bills plus FRNs comprising roughly the high-30s percent of marketable debt in 2024, far quicker to reprice than 7–10 year notes. That accelerates the pass-through from a 10-year near 4.6% to the average interest rate, which Treasury’s dataset shows climbing as legacy sub-2% coupons from 2020–2021 roll away. [8][4][5][3]

What to watch next

  1. By October 31, 2026, the 10-year Treasury yield (FRED series DGS10) records a weekly average at or above 5.00% for at least one week, indicating term premium and supply pressure overcame benign CPI prints. [4]

  2. By December 31, 2026, at least one 30-year Treasury bond auction (new issue or reopening) tails by 3.0 basis points or more versus the when-issued yield at the 1:00 p.m. ET deadline, signaling constrained balance-sheet capacity at primary issuance. [10]

  3. By March 31, 2027, iShares TLT posts a total return of −10% or worse from the July 15, 2026 close to that date (using NAV total return on the fund’s page), consistent with duration pain despite moderating CPI. [7]

Sources

[1] JPMorgan Chase 2023 Shareholder Letter (Jamie Dimon) — outlines CEO views on higher rates, geopolitics, and market risk, anchoring the “shock” narrative.

[2] Congressional Budget Office — Long-Term Budget Projections — provides deficit and debt-to-GDP trajectories that inform issuance and term-premium pressure.

[3] U.S. Bureau of Labor Statistics — Consumer Price Index — supplies CPI data used for the June year-over-year reading and inflation context.

[4] Federal Reserve Bank of St. Louis (FRED) — 10-Year Treasury Constant Maturity (DGS10) — benchmark for long-end yields and the 4.6% reference point.

[5] U.S. Treasury FiscalData — Average Interest Rates on U.S. Treasury Securities — tracks the average coupon cost on outstanding debt to compare against current yields.

[6] Bank of England — Financial Stability Report, December 2022 — documents the UK gilt crisis mechanics, LDI deleveraging, and yield spike magnitudes.

[7] iShares — TLT (20+ Year Treasury Bond ETF) — provides historical performance and duration metrics to illustrate convexity and drawdown risk.

[8] U.S. Treasury — Treasury Borrowing Advisory Committee (TBAC) Q4 2024 Presentation — shows WAM, issuance mix, and debt composition (bills/FRNs vs. coupons).

[9] U.S. Treasury FiscalData — Debt to the Penny — gives levels for debt held by the public to size the rollover base.

[10] U.S. Treasury — Auction Query (official results) — verifies auction tails and bid metrics for 30-year bond sales.

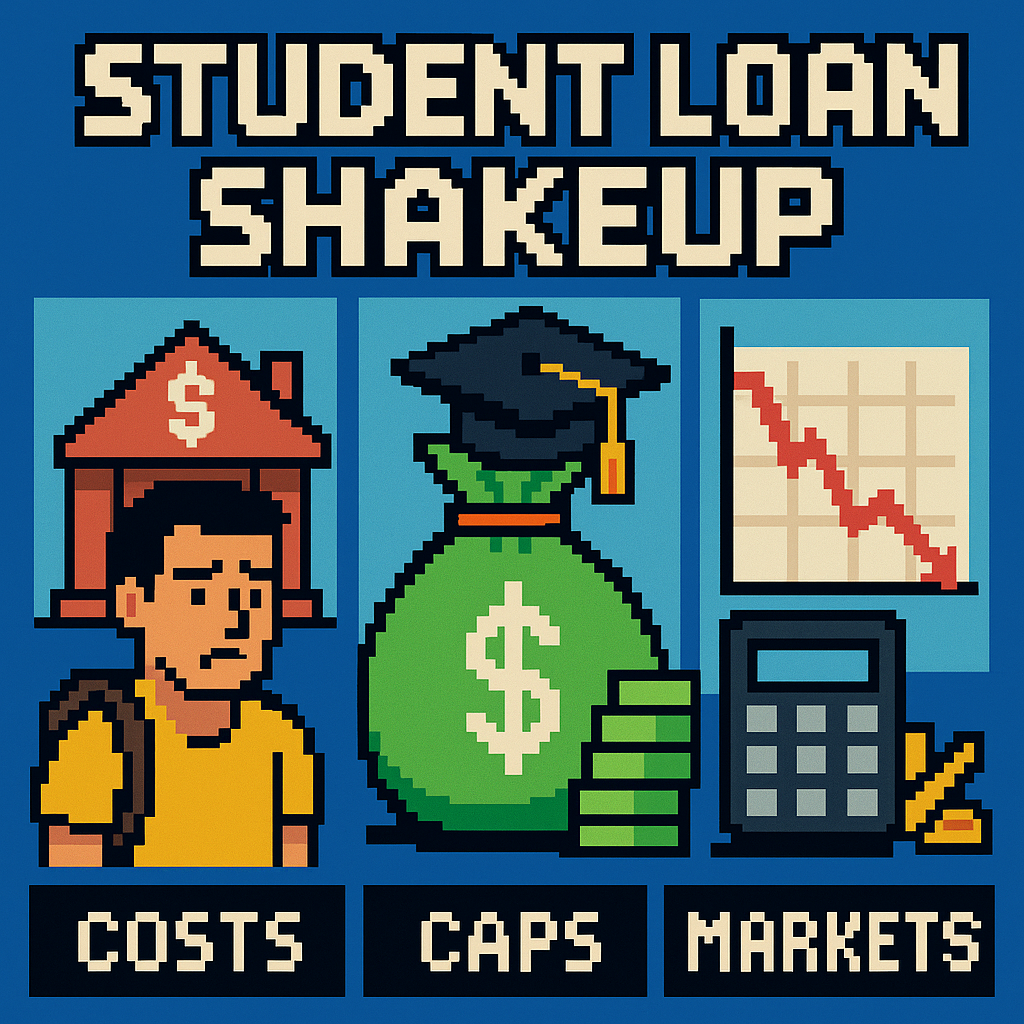
Student Loan Shakeup: Costs, Caps, Markets | Analysis by Brian Moineau

TL;DR

  • Federal student loan changes take effect July 1, 2026: SAVE is gone, RAP and Tiered Standard become the default architecture, grad/Parent PLUS borrowing is capped, and autopay yields a 1% interest cut through June 30, 2028. [1][2][3]
  • The real economic shock isn’t $10 RAP minimums; it’s the hard $20,000/year Parent PLUS cap and the end of Grad PLUS for new borrowers, which will force families and universities to rethink pricing, packaging, and private credit—fast. [3][5]
  • Expect a surge in private lending products pitched at the “PLUS gap,” selective tuition resets in master’s programs, and a messy two‑year scramble as about 7.5 million ex‑SAVE borrowers pick new plans under higher 2026–27 rates. [1][4][7]

What the source said

PBS NewsHour reported that major federal student loan changes start on July 1, 2026. The segment highlighted four headliners: higher interest rates on most new federal loans, a temporary 1% interest discount for borrowers in autopay through June 30, 2028, the elimination of the Biden‑era SAVE plan affecting roughly 7.5 million borrowers, and new borrowing caps for graduate and Parent PLUS loans. PBS previewed the new Repayment Assistance Plan (RAP), noting a $10 minimum payment and an interest subsidy for on‑time payers, while warning of potential payment hikes, rising delinquencies, and borrower confusion. It also flagged caps on graduate/Parent PLUS borrowing as a structural shift that will ripple through household budgets. [1]

Why it matters

  • Households: Parent PLUS caps of $20,000 per year/$65,000 lifetime end the “borrow the rest” era. For any school whose net price exceeds that cap, families must fill the difference from income, savings, institutional aid, or private loans. This creates a predictable, recurring “funding gap” problem for middle‑ and upper‑middle‑income parents starting with the 2026–27 year. [3]

  • Institutions: Eliminating new Grad PLUS and capping Parent PLUS attack two quiet revenue valves that subsidized high‑price master’s programs and undergraduate enrollment smoothing. Schools with high dependence on graduate tuition or on PLUS‑driven yield will feel the cash crunch first, particularly in 2026–27 and 2027–28 as higher fixed rates (e.g., 6.52% undergrad, 8.07% grad unsub, 9.07% PLUS for 2026–27) bite. [3][7]

Original analysis

Consensus says “RAP softens the blow.” I disagree: the real economywide effect is a funding‑source rotation—away from federal parent/grad credit toward family cash, institutional discounting, and private loans—while payments rise modestly for ex‑SAVE borrowers who lose $0 payments. The policy aims to constrain borrowing; it will, but not without second‑order effects in 2026–27 and 2027–28 as private lenders and bursars reset offers. [2][3][4][7]

Named typology: who wins, who loses

  • High‑income, high‑debt graduates (>$100k AGI, >$100k debt): Better off choosing Tiered Standard with a 25‑year term; RAP takes up to 10% of AGI and can cost more monthly, though it’s PSLF‑qualifying. [7]
  • Low‑income borrowers (<$35k AGI): RAP’s $10 minimum plus interest‑waiver mechanics prevent balance creep; total time to forgiveness is 30 years, not 20–25. [3]
  • New Parent PLUS borrowers (all incomes): Locked out of income‑driven plans and PSLF; only Tiered Standard applies, which hardens monthly obligations. [5]
  • Universities reliant on Grad PLUS/Parent PLUS: Revenue risk starts day one of 2026–27; program‑level loan limits that colleges can set add a new internal brake on debt‑fueled enrollment. [3][6]

Back‑of‑envelope math 1: the autopay “1% off”

  • Example: $30,000 undergraduate Direct loan first disbursed in 2026–27 at 6.52% (fixed). Standard 10‑year amortization → monthly ≈ $340; total interest ≈ $10,777. With the temporary autopay 1% rate reduction (to 5.52%) from July 1, 2026 through June 30, 2028, assume autopay for two full years, then reversion to 6.52%. Savings: Year‑1 average balance ≈ $28,500 → ≈ $285 saved; Year‑2 average ≈ $26,100 → ≈ $261 saved; total ≈ $546 before compounding. Order of magnitude: $500–$600 if you stay in autopay. [2][7]

Back‑of‑envelope math 2: the Parent PLUS “gap”

  • Parent PLUS for new borrowers: $20,000 per year cap. Suppose net price after grants and the student’s own federal loans is $35,000 per year at a regional private university. Pre‑cap, a parent could borrow the full $35,000. Post‑cap, annual funding gap = $35,000 − $20,000 = $15,000. Over four years, that’s a $60,000 hole to fill from cash, 529s, institutional plans, or private loans. At $60,000 financed privately at 9% over 10 years, monthly ≈ $760. Families will notice. [3]

2×2: Choosing RAP vs Tiered Standard (new borrowers on/after July 1, 2026)

Debt size Income level Likely better plan Why
Low debt (<$25k) Low income (<$35k) RAP $10 minimum and interest subsidy keep payments tiny and balances from growing; 30‑year horizon is acceptable at low debt. [3]
Low debt (<$25k) High income (>$100k) Tiered Standard (10 years) Short term → less total interest; RAP could demand up to 10% of AGI, which may exceed a 10‑year fixed payment. [7]
High debt (>$100k) Low income (<$35k) RAP The only path that avoids negative amortization; PSLF‑qualifying if borrower is in public service. [3][7]
High debt (>$100k) Mid/high income ($60k–$120k) It depends; many tilt Tiered Standard (20–25 years) RAP scales with income and runs 30 years; Tiered Standard fixes the cost and ends 5–10 years sooner unless pursuing PSLF. [7]

Historical analogue: 2012 and 2013 quietly reshaped graduate financing. In 2012, subsidized Stafford loans for graduate students were eliminated, shifting grads fully to unsubsidized credit. In 2013, Congress tied new loan rates to the 10‑year Treasury via Public Law 113–28, introducing annual rate resets that reappear in 2026–27 rate tables (6.52% undergrad, 8.07% grad unsub, 9.07% PLUS). Those shifts didn’t collapse graduate enrollment, but they raised costs and nudged borrowers toward PLUS and private loans. Today’s elimination of new Grad PLUS for 2026–27 is that earlier ratchet, turned further. [9][8][7]

Named‑stakeholder breakdown: what this means for them

  • U.S. Department of Education: The autopay carrot (1% cut through June 30, 2028) is a portfolio‑health bet to pull borrowers back into on‑time payments as RAP launches and SAVE sunsets, with delinquency rates and IDR uptake as scorecards. [2]
  • NASFAA and campus aid offices: They become translators of the new regime—especially “limited exception” grandfathering rules through mid‑2028—while fielding calls about PLUS caps and RAP eligibility. [3][5]
  • Private lenders (SoFi, Sallie Mae, Discover): The $20,000 Parent PLUS ceiling and the end of Grad PLUS are product‑development gifts; expect “Parent Loan Gap” and “Graduate Bridge” offerings around $15k–$40k annual shortfalls at 8–12% APRs. [3][7]
  • Loan servicers (Aidvantage, Nelnet): Two years of operational churn—autopay enrollments, SAVE exits, RAP onboarding, and plan sunsets by July 1, 2028—will stress call centers and websites; error rates become a reputational risk. [2][3]
  • State flagships and tuition‑dependent privates: Parent PLUS caps will hit high‑net‑price campuses harder; smaller privates that leaned on PLUS to close budget gaps may counter with deeper merit aid or cohort caps in 2026–27. [3][7]

What others are missing

Institutions now have explicit authority to set program‑level federal loan caps below new federal maximums. That change lets colleges limit borrowing for, say, a 12‑month master’s with a weak debt‑to‑income track record by setting a program cap that applies to every enrollee in that program. This tool lets CFOs and provosts “de‑risk” debt outcomes but shifts more cost to students or private markets if tuition doesn’t adjust. Expect uneven adoption: tuition‑dependent master’s and professional programs will move first to manage cohort risk and regulatory optics, while brand‑name programs wait. [3][6]

What to watch next

  1. By December 31, 2026, at least three top private student‑loan brands publicly launch or rebrand “Parent Gap” or “Graduate Bridge” products explicitly marketing around the $20,000 PLUS cap.
  2. By June 30, 2027, at least 10 accredited institutions publicly adopt program‑level federal loan caps below federal maximums for specific master’s programs, citing new authority in the 2026 final rule.
  3. By March 31, 2027, RAP becomes the single largest repayment plan by borrower count in ED’s portfolio reports, surpassing legacy IBR/ICR/PAYE as ex‑SAVE borrowers complete transitions.

My take

I’m bullish on RAP as a stabilizer and bearish on universities’ near‑term revenue across 2026–27 and 2027–28. The two‑year window to June 30, 2028—with the autopay sweetener and legacy plan sunsets—gives borrowers a workable glidepath. But the Parent PLUS and Grad PLUS pivots are the real tectonic plates because they cap the federal spigot that masked tuition inflation after 2013. If your business model depended on unlimited parent and graduate federal credit, the next admissions cycle is your stress test. Cut price, boost aid, or prepare to shrink. The policy intent is to constrain borrowing; it will.

Sources

  1. How the federal student loan changes could impact borrowers — PBS NewsHour (https://www.pbs.org/newshour/show/how-the-federal-student-loan-changes-could-impact-borrowers) — Broadcast explainer that flags SAVE’s end, RAP’s $10 minimum, higher rates, caps, and an estimated 7.5 million affected SAVE borrowers.

  2. U.S. Department of Education Announces Student Loan Interest Rate Reduction — U.S. Department of Education (https://www.ed.gov/about/news/press-release/us-department-of-education-announces-student-loan-interest-rate-reduction) — Official press release confirming the 1% autopay interest reduction through June 30, 2028 and the RAP/Tiered Standard framework.

  3. Federal Student Aid Changes from the One Big Beautiful Bill Act — NASFAA (https://www.nasfaa.org/uploads/documents/Federal_Student_Aid_Change_OB3.pdf) — Detailed summary of final regulations: Parent PLUS $20,000/year and $65,000 lifetime caps, graduate/professional caps, $257,500 lifetime limit, RAP mechanics ($10 minimum; 1–10% of AGI), plan sunsets, and Parent PLUS ineligibility for RAP.

  4. Education Department directs student loan borrowers in SAVE plan to prepare for repayment — Associated Press (https://apnews.com/article/f4e383b6e80f8f4954a1f17404eea199) — News report that more than 7 million SAVE enrollees received notices to choose a new plan starting July 1, 2026.

  5. Federal Parent PLUS Loan Changes: What New Parent Borrowers Need to Know — NASFAA (https://www.nasfaa.org/uploads/documents/OB3_PPLUS_Changes_New_Parent_Borrowers.pdf) — Two‑page brief confirming $20,000/year and $65,000 lifetime caps for Parent PLUS, Tiered Standard as the only repayment, and PSLF implications.

  6. Federal Student Loan Program Changes to Take Effect on July 1, Pending Litigation Outcomes or Legislative Action — Faegre Drinker (https://www.faegredrinker.com/en/insights/publications/2026/6/federal-student-loan-program-changes-to-take-effect-on-july-1-pending-litigation-outcomes-or-legislative-action) — Legal analysis summarizing the May 1, 2026 final rule, repayment plan structures, and ongoing lawsuits that could affect implementation.

  7. Interest Rates and Origination Fees — Iowa State University Office of Student Financial Aid (https://financialaid.iastate.edu/types-of-aid/loans/federal-loan-resources/interest-rates-and-fees/) — Year‑over‑year federal loan rate table showing 2026–27 increases (6.52% undergrad, 8.07% grad unsub, 9.07% PLUS).

  8. Bipartisan Student Loan Certainty Act of 2013 (Public Law 113–28) — Congress.gov (https://www.congress.gov/bill/113th-congress/senate-bill/1334) — Statute that ties new federal loan rates to the 10‑year Treasury, creating annual rate resets.

  9. Graduate Students No Longer Eligible for Subsidized Loans — NACUBO (https://www.nacubo.org/News/2012/3/Graduate-Students-No-Longer-Eligible-for-Subsidized-Loans) — 2012 policy change summary confirming elimination of subsidized Stafford loans for graduate students.


Related update: We recently published an article that expands on this topic: read the latest post.
Related update: We recently published an article that expands on this topic: read the latest post.
Chips Rally Fuels Market Rebound | Analysis by Brian Moineau

TL;DR

  • Chips led a rebound from the Fed-led sell-off as semiconductors ripped and the Nasdaq rose 1.91%, while the S&P 500 gained 1.08% on June 18, 2026; energy lagged as WTI crude slid to $73.58 on reports of a U.S.–Iran détente. [1][4]
  • Breadth improved under the surface: the Russell 2000 outperformed with nearly a 2% gain, while defensives wobbled—classic risk-on when oil and rate fears cool together in New York trading. [1][2]
  • The tape says “AI back on,” but the investable takeaway is rotation: lower crude compresses energy earnings while easing input and financing costs for power-hungry data center suppliers and small-cap borrowers in the U.S. market. [1][3][4]

What the source said

CNBC’s live blog logged a broad rebound after the Fed-driven slump: the S&P 500 closed up 1.08% to 7,500.58, the Nasdaq rose 1.91% to 26,517.93, and the Dow added 0.14% to 51,564.70 on June 18, 2026. Semiconductors led; Intel drew positive chatter linked to Apple, and AI-adjacent names such as Corning jumped 7%. The Russell 2000 outperformed with nearly +2% on the day, while the S&P energy sector fell almost 2% as WTI dipped to $73.58 on U.S.–Iran agreement headlines. Individual movers included Enphase (+10%), Corning (+7%), and Exxon/Chevron (−2%+), while Kroger slipped after a one‑cent EPS miss despite a revenue beat. [1]

Why it matters

Two policy levers—rates and oil—just loosened their grip on risk assets after a midweek hawkish Fed tone and a Thursday oil slide to the low‑$70s per barrel, as reported by Axios and Reuters from Washington and Tehran angles. If crude holds near $73–$76 through August 2026, gasoline and freight costs ease, trimming the inflation impulse that pressured multiples in Q2. In that setup, equity buyers can re-risk into growth stories (chips/data centers) without fighting duration headwinds. [2][3][4]

Small-cap industrials and services tied to diesel and short-term borrowing—think Russell 2000 constituents in trucking, tools, and regional services—gain operating and financing relief when oil dips and yields stabilize into Q2 2026 quarter‑end. Conversely, energy producers face a valuation headwind as futures reprice supply risk lower on a U.S.–Iran thaw around the Strait of Hormuz. Active managers entering June 2026 month‑end must choose between chasing AI beta or leaning into a breadth turn that favors cyclicals and balance‑sheet repair. [1][2][4]

Original analysis

Contrarian read: June 18, 2026 looked more like rotation than a pure AI melt-up in New York.

  • Consensus: “The AI trade is back—buy chips because the Fed sell-off was a blip.” The CNBC live blog framed the day that way while the Fed’s June messaging lingered. [1][6]
  • My case: Semis ripped, but the simultaneous pop in the Russell 2000 and slump in energy are cleaner breadth tells than another megacap surge. After a chip “bloodbath” earlier in June, next‑day rebounds often fade unless credit and input costs improve together; WTI at $73–$74 plus a Friday Juneteenth holiday that curbs catalysts tilts flows toward cyclicals over narrow AI leaders. [1][2][4][6]

Back‑of‑envelope calculation: Kroger’s miss was optical, not fundamental, in Q1 FY2026.

  • KR printed $1.58 in Q1 EPS vs. $1.59 expected—a $0.01 shortfall, or ~0.63% below consensus (0.01/1.59). Revenue was $46.12B vs. $45.59B, a $0.53B beat—about 1.16% above expectations (0.53/45.59). A 7% intraday drawdown on a one‑cent EPS miss—even as revenue outperformed—implies punishment for guidance quality or margin mix, not headline growth, and sets up mean reversion if fuel and promo costs moderate into H2 2026. [1][5]

Named‑stakeholder breakdown: the week’s winners and losers map to oil and AI.

  • Intel (INTC): Re‑rating risk tilts positive near term. A “brand upgrade” narrative tied to Apple chatter and a broad semi bounce catalyzed gains; sustained upside needs data center share wins, not just headlines. Tactically constructive into June month‑end while SOX momentum runs. [1][3]
  • Apple (AAPL): Bank of America nudged FY26E EPS to $8.63 as pricing offsets memory tightness; a $100 Pro/Pro Max hike is the tell. Risk: elasticity in a stretched replacement cycle for premium iPhones in the U.S. and China. [1]
  • Enphase (ENPH): IQ9S microinverter traction plus a Barclays upgrade produced a 10% jump; if oil stays soft and residential paybacks stabilize in H2 2026, backlog conversion can carry shares. [1]
  • Exxon/Chevron/Occidental: Oil’s downdraft—linked to U.S.–Iran détente talk and Hormuz passage risk easing—compresses near‑term cash yields and de‑rates beta. Discipline on 2026 capex versus buybacks will decide multiple support. [1][3][4]
  • Corning (GLW): A stealth AI beneficiary via glass, optics, and fiber; a 7% pop signals the market’s hunt for second‑order suppliers with real EBITDA tied to data center builds in places like Arizona and Ohio. [1]

Historical analogue: 2013’s mini “taper tantrum” flipped once rates found a level, and small caps plus cyclicals staged a summer catch‑up while energy lagged on supply comfort; 2026’s hawkish Fed tone followed by a breadthy risk‑on day with softer crude rhymes with that script. [2][4][6]

2×2: Who wins if chips lead while WTI stays below $80 into Q3 2026? [4]

  • High energy use + AI adjacency (cooling, power, optics suppliers): Win big—margin tailwinds and top‑line growth.
  • High energy use + no AI tie (airlines, trucking): Win moderate—cost relief without multiple expansion.
  • Low energy use + AI adjacency (software): Mixed—sentiment help, limited operating leverage.
  • Energy producers (upstream, oil‑beta): Lose near term—lower realized prices and weaker narrative carry.

Net: Thursday’s bounce is more than chips; it’s a breadth tell powered by cheaper oil and “good enough” macro into late June 2026. Position sizing should reflect that—add to cyclicals and small caps with operating leverage to sub‑$80 WTI, keep AI but prefer second‑order suppliers over crowded leaders. [1][2][4]

What others are missing

Coverage fixates on index points and AI tickers, but the oil‑tape linkage—with the Strait of Hormuz explicitly in play via a U.S.–Iran ceasefire framework—carries second‑order consequences for June–July CPI prints in the United States. That supply relief pushes WTI toward the mid‑$70s, compresses energy earnings, and boosts P&Ls for energy‑intensive end markets like glass, optics, cooling, and logistics tied to U.S. data centers. If crude sticks near $73–$76 instead of $85, multiples expand more for small caps and capital goods than for an already‑prized AI complex. Watch oil first; it’s the breadth key. [2][3][4]

What to watch next

  1. By August 15, 2026, WTI crude trades below $70 intraday at least once as supply risk premia fade on further clarity around the U.S.–Iran framework. [4]

  2. Between June 24 and September 30, 2026, the Russell 2000 outperforms the S&P 500 by at least 300 bps, reflecting falling fuel costs and improving breadth in U.S. equities. [1][2]

  3. By Q3 2026 earnings season (reported October–November 2026), at least two of Exxon, Chevron, or Occidental guide capex lower or slow buybacks versus H1 2026 cadence, acknowledging weaker realized prices. [1][4]

My take

Chasing semis after a big green day is easy; leaning into energy‑sensitive cyclicals and quality small caps while WTI sits at $73.58 is harder but smarter for Q3 risk. I’ll keep core AI exposure, but I’ll add to second‑order suppliers (glass, optics, cooling) and borrowers with high operating leverage to cheaper fuel. If a credible U.S.–Iran détente holds and crude drifts to the low‑$70s, the next leg won’t be five tickers—it’ll be 500 across the Russell 2000 and U.S. cyclicals. I’m buying the rotation, not the headline, with a 2026 lens on breadth. [1][2][4]

Sources

  1. S&P 500 closes higher, Nasdaq climbs nearly 2% as chips fuel comeback from Fed sell-off: Live updates — CNBC (https://www.cnbc.com/2026/06/17/stock-market-today-live-updates.html) — Primary live blog with index closes, sector moves, and notable stock drivers including energy weakness and small-cap strength.

  2. How major US stock indexes fared Thursday 6/18/2026 — AP News (https://apnews.com/article/411ec68891aa5dc7d7f684e0305e2aa3) — Confirms the broad rebound, notes calendar effects around Juneteenth, and frames weekly context.

  3. Wall St advances as Iran deal optimism offsets hawkish Fed; Intel soars — Reuters via Investing.com (https://au.investing.com/news/economy-news/wall-st-futures-bounce-back-as-usiran-deal-optimism-balances-hawkish-fed-intel-up-4494347) — Corroborates semiconductor leadership and market balancing of Fed messaging with geopolitical tailwinds.

  4. Oil prices sink on announcement of Iran deal — Axios (https://www.axios.com/2026/06/14/oil-prices-us-iran-war-hormuz-strait-peace-deal) — Details on the U.S.–Iran agreement, Strait of Hormuz implications, and the associated drop in WTI.

  5. Kroger (KR) Q1 Earnings Miss Estimates — Zacks (https://www.zacks.com/stock/news/2939171/kroger-kr-q1-earnings-miss-estimates) — Confirms the $1.58 EPS vs. $1.59 consensus and revenue outperformance, enabling the calculation.

  6. June Fed Meeting: Updates and Commentary — Kiplinger (https://www.kiplinger.com/news/live/fed-meeting-updates-and-commentary-june-2026) — Documents the midweek Fed‑led sell‑off and rate tone that set up the rebound dynamic.


Related update: We recently published an article that expands on this topic: read the latest post.

30-Year Yield at 5%: Pressure on Borrowing | Analysis by Brian Moineau

The long end is talking: why the 30‑year yield hovering around 5% matters

The yield on 30‑year US government debt hovered around 5% this week, and that simple sentence carries a lot of freight. Long‑term Treasury yields aren’t just an abstract market statistic — they’re a price signal that ripples into mortgage rates, corporate borrowing costs, pension funding, and how investors price risk across the global economy. When the 30‑year yield touches a round number like 5%, markets and money managers pay attention because it’s both psychological and practical: borrowing math changes, balance sheets flex, and strategy conversations shift.

Let’s walk through why this move is more than noise, what’s driving it, and what to watch next.

Why a 5% 30‑year yield is news

  • A higher 30‑year yield means the government pays more to borrow for three decades. That raises the baseline for long‑term interest rates across the economy.
  • Mortgage rates tend to track the long end; when the 30‑year Treasury rises, so does the cost of a 30‑year fixed mortgage, squeezing housing affordability.
  • Pension plans and insurers mark long liabilities to market prices; sustained higher yields alter funding ratios and the economics of fixed‑income allocations.
  • The long end reflects expectations about inflation, growth, fiscal policy and global demand for safe assets — it’s where the “what‑do‑we‑really‑expect over decades” conversation happens.

Put simply: moves at the long end force investors and policymakers to re‑ask the question, “How expensive will money be for the next generation?”

The yield on 30‑year US government debt hovered around 5% — what pushed it there?

Several factors have conspired to nudge the long‑end higher:

  • Inflation and inflation expectations: Even if headline CPI has cooled from its peak, stickier or unpredictable prices keep investors demanding higher compensation for tying money up for 30 years.
  • Fed policy and rate path bets: If markets push back expectations for Federal Reserve rate cuts — or see a risk the Fed may stay restrictive longer — long yields can rise as investors price in a higher neutral rate or slower easing.
  • Fiscal dynamics and issuance: Large or persistent deficits mean more Treasury supply. If global demand for long‑dated paper softens, yields need to move up to attract buyers.
  • Geopolitical and market stress: Events that change risk perceptions (commodity shocks, trade disruptions, regional conflicts) can alter both inflation expectations and safe‑asset flows, putting upward pressure on long yields.
  • Technicals and liquidity: Auction weakens, lower foreign buying, or flows out of long‑duration ETFs can amplify a move once it starts.

Those forces don’t act in isolation. The market is sensitive to small changes in each — and when they line up, the long end can move quickly.

What it means for everyday markets and people

  • Mortgages and housing: Long‑term mortgage rates often move with the 30‑year Treasury. A sustained rise toward or above this 5% zone lifts monthly payments for new homebuyers and can chill refinancing activity.
  • Corporate borrowing and investment: Companies issuing long‑dated bonds face higher interest costs, which can alter capital expenditure plans and valuations.
  • Risk assets: Higher long yields can make bonds more attractive versus stocks, or at least raise the hurdle rate for equities — especially for growth companies whose valuations rely on low discount rates.
  • Government interest expense: Higher long yields increase the present value cost of future debt. For a large issuer like the U.S., that matters for budget math if yields stay elevated.
  • Savers and retirees: Higher yields on long Treasuries can be a silver lining for savers who can ladder or buy duration; but pension plans may mark down liabilities, creating funding headaches.

A closer look at the signal: is this a temporary blip or a regime shift?

This is the central debate. A few ways to think about it:

  • Temporary shock view: If the rise is driven by a transitory supply/demand mismatch, geopolitical blip, or a momentary repricing of Fed timing, yields can retreat once the shock subsides.
  • Structural view: If the market is re‑establishing a higher equilibrium for long rates — because inflation expectations have permanently risen, fiscal pressures are larger, or the global appetite for long duration has waned — then 5% may be the new normal for the long end (or a floor, not a ceiling).

History shows both patterns: yields spike and fall around shocks, but they also trend to new ranges when the macro backdrop changes. The cadence of incoming inflation data, the Fed’s communications and Washington’s fiscal trajectory will be the deciding factors.

What investors and policymakers should watch next

  • Inflation prints and the Fed’s language about policy normalization or cuts.
  • Treasury auction results and demand from core buyers (domestic real money managers, foreign central banks).
  • Data on mortgage rates and housing activity — they’ll reveal how the rate move is transmitting to the real economy.
  • The shape of the yield curve: persistent steepening or flattening tells different stories about growth and recession risk.
  • Global yields: long bonds elsewhere moving higher can validate a global re‑pricing, while an isolated U.S. rise points to domestic fiscal or policy drivers.

Market mood and strategy implications

  • For fixed‑income investors: higher long yields reopen income opportunities — ladders and high‑quality duration can become attractive again — but timing matters if volatility spikes.
  • For equity investors: reassess duration risk in portfolios, favor cash‑generating businesses if discount rates rise, and watch sectors more sensitive to financing costs.
  • For households: locking mortgage rates or reassessing refinancing math may make sense if you expect yields to stay higher for months.
  • For policymakers: a durable rise in long yields forces honest conversations about deficit paths and monetary‑fiscal interactions.

My take

The 30‑year yield flirting with 5% is a reminder that the bond market often gets ignored until it tugs on the rest of the economy. This isn’t an automatic recession signal — but it is a market vote demanding clarity. Investors and policymakers should treat the move as both a risk and an opportunity: risk if it’s the start of a sustained repricing that pressures growth; opportunity if elevated yields buy savers and long‑duration buyers income they haven’t seen in years.

In short: markets are asking for a clearer plan — on inflation, on Fed timing, and on fiscal responsibility. How those answers arrive will determine whether 5% is a headline or the new baseline.

A few practical takeaways

  • Revisit duration exposure: consider whether you want to lock yields now or wait for volatility to subside.
  • Homebuyers: check refinance vs. purchase math quickly — small yield moves change monthly payments meaningfully.
  • Watch the data calendar: inflation, payrolls, and Treasury auctions will shape the next moves.

Sources


Related update: We recently published an article that expands on this topic: read the latest post.

Related update: We recently published an article that expands on this topic: read the latest post.

Powell’s Warning: Gas Spike Clouds Fed | Analysis by Brian Moineau

When Jerome Powell Says “Could Go Lower or Higher,” Wall Street Listens — Especially as Gas Prices Rise

The markets are watching Jerome Powell closely, and the conversation has a new, prickly edge: Wall Street grows more worried about growth impact from higher gas prices. Powell’s recent comments — that risks to the economy make it plausible rates could move either lower or higher — didn’t come from a policy meeting note; they came from a central banker trying to square a stubbornly uncertain map. Against that backdrop, a surge in energy costs is doing more than pinching consumers at the pump: it’s making investors rethink the odds on growth, inflation, and what the Fed will do next.

Powell’s framing is important because it acknowledges a two-way street. The Fed must weigh inflation upside from an energy shock against downside risks from a cooling labor market or slowing demand. For markets, that ambiguity is often worse than a clear signal: uncertainty breeds volatility and forces rapid repricing when new data — like crude spikes or consumer spending slumps — arrive.

Why Powell’s “lower or higher” phrasing matters

  • It signals uncertainty instead of commitment. The Fed is not telegraphing an imminent easing cycle — nor is it promising to hike. That keeps markets guessing.
  • It acknowledges asymmetric risks. A supply shock (say, geopolitically driven oil jumps) can lift inflation quickly; a labor slowdown or credit squeeze can weaken growth just as fast.
  • It elevates the role of incoming data. Markets will now hang on each energy report, payroll print, and inflation snapshot because those data points tilt the “lower vs. higher” balance.

That dynamic is especially potent now because oil and gasoline prices have shown renewed volatility. Recent supply disruptions and geopolitical tensions have pushed Brent and WTI prices higher, and U.S. pump prices have edged up — not a small matter for an economy where consumer spending still carries a lot of weight.

Wall Street grows more worried about growth impact from higher gas prices

Higher gas prices do three immediate things: they reduce real household income at the margin, raise the cost of transporting goods, and feed into headline inflation. All three bite into corporate earnings, consumer confidence, and the Fed’s calculus.

  • Consumers: Pump pain reduces discretionary spending. Families with tighter budgets tend to delay large purchases and cut back on restaurants, travel, and other services — the very sectors many investors lean on for cyclical growth.
  • Producers and supply chains: Diesel and transport costs filter into grocery bills and retail margins, pressuring companies that can’t pass the full cost to customers.
  • Monetary policy: If energy-driven inflation expectations take hold, the Fed could need to act to prevent a second-round wage-price spiral. Conversely, if high gas prices choke demand enough, the Fed might hesitate to tighten further or even consider easing sooner.

The result is a tricky feedback loop: rising energy prices can raise inflation and interest-rate expectations at the same time they weaken growth — a classic stagflation risk that terrifies equity markets and complicates policy.

What markets are pricing now — and why that matters

Since the uptick in oil, markets have repriced several things quickly:

  • Treasury yields rose as investors demanded compensation for higher expected inflation and possibly steeper policy paths.
  • Equity valuations shifted, with broad selling pressure on growth stocks sensitive to higher discount rates, and rotation into energy and defensive sectors.
  • Probability models for Fed rate changes were scrambled: futures and options markets began reflecting a wider distribution of outcomes, echoing Powell’s “lower or higher” language.

When markets price in both higher inflation and slower growth, portfolio managers face hard allocation choices. Short-term, that often means de-risking and favoring cash-flow-stable businesses. Over longer horizons, it can mean re-evaluating earnings projections across sectors if sustained energy costs are assumed.

A few scenarios to watch

  • Short-lived energy spike: If oil and gas bounce up quickly but then retreat, the Fed likely stays data-dependent, and the markets might calm once inflation peaks and the growth hit proves shallow.
  • Persistent high energy prices: That raises the chance of a policy response to curb inflation — potentially higher rates for longer — even as growth slows. This is the worst-case outcome for stocks and consumer confidence.
  • Demand-driven slowdown: If high energy costs trigger a spending pullback large enough to weaken labor markets, the Fed could pivot toward easing, which would boost risk assets but potentially widen long-term inflation expectations.

Each scenario lands differently for investors and households; the common thread is that energy prices amplify uncertainty.

The investor dilemma

Transitioning between sections, the question for investors becomes: hedge or hold? Short-term traders will trade volatility. Longer-term investors must decide whether the energy shock is a cyclical blip or a structural change to margins and consumer behavior.

  • Defensive posture: Increase exposure to sectors that historically outperform in stagflation-like environments — energy producers, consumer staples, and select industrials with pricing power.
  • Selective offense: Look for companies with strong balance sheets and pricing power that can protect margins or pass on higher costs.
  • Liquidity and duration: Reduce exposure to long-duration assets if the probability of higher-for-longer rates rises.

My take

Powell’s candor — that rates “could go lower or higher” — is honest central banking in a noisy world. It’s a reminder that modern monetary policy operates in a landscape of shocks, not certainties. The immediate worry on Wall Street about the growth impact from higher gas prices is well-grounded: energy is a lever that moves inflation and demand simultaneously.

Investors should respect the ambiguity by emphasizing flexibility. Short timelines matter now: monitor energy markets, CPI and PCE prints, and payrolls closely. Over longer horizons, focus on businesses with durable cash flows and pricing power. Policymakers will do their job; your portfolio needs to do yours.

Sources


Related update: We recently published an article that expands on this topic: read the latest post.

Markets Jitter as War Risks Lift Oil | Analysis by Brian Moineau

Investor Unease Builds Entering War’s Fifth Week

The phrase "Investor Unease Builds Entering War’s Fifth Week" isn't just a headline — it's the mood across markets as traders wrestle with how a protracted Middle East conflict could ripple through oil, inflation and interest-rate expectations. Treasuries rose, Brent crude hit roughly $115 a barrel, and US stock futures bounced, all while the market recalibrated bets on future Fed moves. (uk.finance.yahoo.com)

The immediate snapshot

  • Treasuries: Yields slipped as investors sought safe-haven paper, pushing prices up amid growing worries about slower growth if the conflict intensifies. (finance.yahoo.com)
  • Oil: Brent moved into the mid‑triple digits — near $115 a barrel in some sessions — on fears supply could be disrupted or that regional escalation will spur a pricing premium. (uk.finance.yahoo.com)
  • Equities: Futures bounced as risk sentiment oscillated; markets are trying to separate short-term shock from the longer-term earnings picture. (apnews.com)

These moves reflect a market caught between two narratives: one that the conflict will be contained and another that it will trigger broad inflationary pressure and slower growth.

Why bond and oil moves matter to everyday investors

Bond yields and oil prices are market barometers with real effects. Higher oil feeds into headline inflation via fuel and transport costs. If oil stays elevated for months, central banks may hesitate to cut rates and could even consider hikes — a dynamic that pushes bond yields up and raises borrowing costs across the economy. Conversely, if investors fear a sharp growth slowdown, they pile into Treasuries, lowering yields.

Over the past weeks, we’ve seen that tug-of-war. Some sessions show yields sliding as flight-to-quality dominates; others show yields rising when traders price in the inflation risk from costly oil. That whiplash is why volatility feels so high right now. (uk.finance.yahoo.com)

Markets are testing scenarios, not certainties

Investors are running through scenarios out loud: a short, localized flare-up; a prolonged regional war; or a broader escalation drawing in more actors and supply chokepoints. Each scenario produces different market outcomes:

  • Short, contained conflict: modest oil spike, transient volatility, central banks stay on hold.
  • Protracted conflict: sustained oil premium, upward pressure on inflation, central banks less likely to ease — or potentially forced to tighten — which hurts growth.
  • Major escalation: supply shocks, stagflation risk, deep equity drawdowns and safe-haven rallies in bonds and gold.

Right now, pricing indicates markets are no longer confidently betting on easing from central banks soon — in fact, at times they’ve shifted toward pricing later or fewer rate cuts. That’s a major pivot from just a few months ago. (finance.yahoo.com)

The investor dilemma

Investors face a classic policy-risk vs. growth-risk dilemma. Higher oil and energy costs push up inflation expectations; that makes central banks look hawkish and bond yields rise. But if the conflict chokes demand (tourism, trade, risk appetite), growth assumptions fall and equities suffer.

Add to that the practical issue of hedges: options and volatility products may be expensive, gold pays no yield, and owning long-duration bonds is risky if yields climb. That narrows straightforward protection choices, which amplifies unease. (investing.com)

What to watch next

  • Oil price trajectory. If Brent stays elevated above $100–115 for several weeks, inflation pressures will firm and rate expectations will adjust. (uk.finance.yahoo.com)
  • Treasury yields across the curve. Sharp moves higher in short-term yields would signal the market is pricing a more hawkish Fed. (finance.yahoo.com)
  • Risk sentiment in equities and credit spreads. Widening spreads often precede tougher economic outcomes. (investing.com)

Short-term traders will react to headlines; longer-term investors should focus on the directional persistence of these indicators rather than day-to-day noise.

What this means for portfolio posture

  • Flexibility over rigidity. In volatile geopolitics, strategies that allow rebalancing and liquidity tend to outperform rigid bets.
  • Diversify sources of carry and protection. Cash-like instruments, tactical exposure to inflation assets, and carefully sized hedges can help.
  • Avoid binary thinking. Neither “markets will always recover quickly” nor “everything’s collapsing” is a reliable base case; plan for multiple paths.

Markets are pricing uncertainty, not certainties — and that requires humility in positioning.

My take

We’re living through a market that’s oscillating between protective reflexes and risk-seeking rebounds. The headline "Investor Unease Builds Entering War’s Fifth Week" captures the tenor: investors are unsettled because the outcome is wide open and the economic pathways diverge sharply depending on how the conflict unfolds. Expect more chop, and let persistence in macro indicators — not daily headlines — guide bigger allocation moves. (uk.finance.yahoo.com)

Final thoughts

Uncertainty begets re-pricing. In the coming weeks, watch oil, yields and credit spreads for signals about which narrative is gaining traction. For now, prudence, diversification and clarity about your time horizon remain the investor’s best allies.

Sources


Related update: We recently published an article that expands on this topic: read the latest post.


Related update: We recently published an article that expands on this topic: read the latest post.
When the 60/40 Hedge Stops Working | Analysis by Brian Moineau

When the Old Hedge Breaks: Markets, War and the Vanishing Safe Harbor

Government bonds, which typically rise during periods of market stress to cushion equity losses, are now moving in the same direction with stocks as oil spikes and geopolitical shockwaves ripple through markets. That sentence — uncomfortable for anyone who built a portfolio on a 60/40 bedrock — captures the current dilemma: the classic stock-bond hedge is fraying just when investors want it most.

The last few weeks of conflict-driven volatility have amplified a trend that began during the inflation shock of 2021–22. Rising oil and commodity prices, higher-for-longer interest-rate expectations, and soaring uncertainty have pushed equities and government bonds into positive correlation episodes. Instead of bonds cushioning equity losses, both assets have been selling off together — and that changes everything for risk management.

Why bonds stopped being a reliable hedge

  • Inflation and rate expectations: When war pushes oil higher, it can revive inflation fears. Central banks respond (or are expected to respond) by keeping rates elevated, which lowers bond prices. At the same time, higher rates compress equity multiples. The net result: stocks and bonds falling together.
  • Structural balance-sheet changes: Governments ran large fiscal deficits in the pandemic era and later, increasing sovereign debt supply. This makes bond markets more sensitive to inflation and growth worries than in the low-rate decades before 2020.
  • Levered and crowded trades: Many institutional strategies (risk parity, certain hedge funds and derivative overlays) assumed negative stock-bond correlation. They used leverage expecting bonds to offset equity drawdowns. When hedges fail, forced deleveraging can magnify moves across asset classes.
  • Commodity and geopolitical channels: Oil is a key pivot. A sharp oil spike both increases inflation expectations and reroutes investor flows into energy and commodity plays — which can leave traditional defensive assets exposed.

Transitioning from these drivers to market behavior, we saw concrete signs in recent sessions: yields rose (prices fell) as stocks dropped, and volatility products saw heavy trading as investors scrambled for alternatives.

Investors hunt for new hedges

With the old playbook under stress, market participants are exploring alternatives.

  • Gold and select commodities have re-emerged as classic inflation/war hedges; gold’s recent surge illustrates its appeal when both bonds and stocks look vulnerable.
  • Volatility strategies, including long-VIX or structured products that profit from sudden volatility spikes, have enjoyed renewed interest. These can work as tactical hedges but are expensive if held long-term.
  • Defensive equity exposures (quality, dividend growers, and certain value sectors like energy and select industrials) are getting re-evaluated for their resilience in stagflation-like scenarios.
  • Real assets and inflation-linked bonds (TIPS in the U.S.) are rising on investor lists, though TIPS correlate with nominal bonds when real rates move.
  • Some allocators are leaning toward absolute-return or multi-strategy funds that can short or hedging dynamically, while others increase cash buffers to preserve optionality.

Importantly, none of these is a perfect substitute: each hedge has trade-offs in cost, liquidity, and long-run return drag.

Government bonds, which typically rise during periods of market stress to cushion equity losses, are now moving in the same direction with stocks as oil…

This sentence deserves its own moment because it spells the practical problem for long-term investors: if your bond sleeve no longer reliably cushions equity drawdowns, portfolio outcomes change. Retirement glide paths, target-date funds, and many risk models assumed a persistently negative stock-bond correlation — an assumption the market is challenging.

Analyses from major institutions and research groups show this is not a one-off. Historical data indicate that negative stock-bond correlation was an “anomaly” linked to a long disinflationary regime. When inflation breaches certain thresholds — or when supply shocks dominate — correlation tends to revert to positive territory. So we aren’t merely reacting to headlines: the macro structure has changed.

Practical moves for investors (the checklist)

  • Revisit assumptions: Re-run stress tests on multi-asset portfolios using scenarios where stocks, bonds and the dollar all fall together. That “triple red” outcome is more plausible now than it was five years ago.
  • Size hedges to the mission: For those near retirement or needing liquidity in the next few years, costlier but more reliable hedges (options, managed volatility products, inflation-protected debt) may be justified. Long-horizon investors can tolerate some short-term drag.
  • Diversify hedge types: Combine real assets, volatility exposure, and selective credit or alternative strategies rather than overloading on one single hedge that might fail under certain stressors.
  • Watch liquidity and counterparty risk: In a stress event, illiquid hedges can be unusable or deeply discounted, and leveraged SCAs can force unhelpful sales.
  • Keep fees and decay in mind: Some hedges (constant volatility ETFs, long-dated options) have structural costs. Know the expected drag and calibrate position sizes accordingly.

What history and research tell us

Research and institutional commentary support the idea that stock-bond correlation depends on the macro environment. Periods of high inflation or supply-driven shocks have historically produced positive correlations. Recent work by policy and research groups highlights that the pandemic-era low-inflation regime was not the default; markets can and do revert to regimes where traditional diversification underperforms.

That doesn’t mean bonds are irrelevant — they still provide income and play many roles in portfolios — but their blanket role as downside insurance is less reliable when inflation and policy-rate uncertainty dominate market moves.

My take

We’re in a regime where context matters more than blanket rules. The 60/40 baseline still has merits for long-term return expectations, but investors must be honest about what it will and won’t do in a surge-inflation, geopolitically stressed world.

So, be proactive: test portfolios against bad-but-plausible scenarios, size hedges to your time horizon and tolerance for short-term pain, and accept that some protection will cost you. In a market where war, oil, and inflation can conspire to move supposedly uncorrelated assets together, resilience is built through flexibility and planning — not faith in past correlations.

Closing notes

  • Expect more headline-driven volatility as commodity prices react to geopolitical developments.
  • Central bank communications will matter — and may move bond markets more than geopolitical headlines at times.
  • For most investors the response will be gradual: rebalancing assumptions, diversifying hedge types, and paying attention to liquidity.

Sources


Related update: We recently published an article that expands on this topic: read the latest post.


Related update: We recently published an article that expands on this topic: read the latest post.

S&P 500 Pauses as Software Stocks Slide | Analysis by Brian Moineau

Markets on a Short Week: Why the S&P 500 Is Stalling and Software Stocks Are Getting Hit

It’s a weird kind of market mood — not a panic, not a party. The S&P 500 opened a holiday-shortened week largely flat, but the index has now slipped for two weeks in a row. Much of the heat is on software and other tech-related names as investors wrestle with a familiar tension: the promise of AI-driven growth versus the reality of big, uncertain spending and shifting profit prospects.

What happened this week — the headlines that matter

  • The S&P 500 was little changed to start a shortened trading week while software names slid.
  • The broad index has recorded declines for two consecutive weeks — enough to make investors pause after a long stretch of gains earlier this year.
  • Tech megacaps and AI-related names remain the primary market movers, producing big swings that ripple across the index because a handful of companies carry outsized weight.

Why software and tech are getting punished

  • AI euphoria has been a two-edged sword. Expectations for automation and generative AI have driven massive capital allocation toward chips, cloud infrastructure and software, pushing valuations higher. When companies signal large, front-loaded AI spending or give cautious guidance about monetizing those investments, investors react harshly.
  • The market’s “shoot first, ask questions later” instinct: once a narrative shifts from “AI = endless upside” to “AI costs may not pay off quickly,” stocks perceived as vulnerable (particularly in software and services) face steep re-pricing.
  • Earnings and guidance season remains the catalyst. Even beats can be punished if forward commentary hints at slower growth or heavier investment. That’s enough to drag the S&P when the companies affected have significant index weight.

The bigger picture: not a broad market breakdown, but a rotation and recalibration

  • This isn’t a textbook market crash. Other parts of the market — cyclical sectors, financials, energy at times — are behaving differently. What we’re seeing is sectoral stress and volatility inside an otherwise range-bound market.
  • Interest-rate and inflation dynamics still matter. Any signs that inflation is cooling can calm rate-cut expectations and lift sentiment, while stronger data keeps yields elevated and increases the discount on long-duration tech earnings.
  • The concentration effect: When a few large tech names rally or slump, headline moves in the S&P can look extreme even though much of the market is not mirroring that behavior.

Smart ways investors are responding (what I’m seeing from the desks)

  • Rebalancing from concentrated AI/mega-cap positions into broader, less-correlated exposures (value, cyclicals, small- and mid-caps).
  • Trimming positions where guidance looks shaky rather than selling everything. Earnings commentary is getting more scrutiny than raw headline beats.
  • Using volatility to add selectively: investors who believe in longer-term AI winners are sometimes averaging into names after pullbacks, but with tighter risk controls.

Takeaways for investors and readers

  • Markets are digesting the AI narrative: enthusiasm is still real, but the “how and when” of monetization is being questioned. That shift shows up first and loudest in software and AI-adjacent stocks.
  • Two down weeks for the S&P 500 is a reminder that even a generally healthy market can wobble when a few big sectors re-price.
  • Watch earnings calls and forward guidance closely — the market is trading less on past results and more on future spending and margin implications.
  • Keep an eye on macro data (inflation, employment, Treasury yields). Those signals influence how investors discount long-duration tech profits.

A few tactical points to consider

  • If you’re long-term focused: short-term swings are normal; use pullbacks to reassess positions versus panic-sell.
  • If you’re trading: volatility favors active risk management — tighter stops, hedges, or smaller position sizes.
  • For diversified investors: remember that index moves can mask underlying breadth. The S&P’s headline action might overstate the degree of weakness across other sectors.

My take

There’s a healthy re-pricing happening more than a breakdown. The market is trying to put sensible valuations on companies that face meaningful strategic decisions about AI: how much to spend, where to compete, and how quickly that spending will turn into profit. That uncertainty produces headline volatility — especially in a shortened week with fewer market hours to digest information. For long-term investors, this is a useful reminder to focus on fundamentals and on the companies that show both the ability to invest sensibly and the path to profitability.

Sources

(Note: this piece was written with a base narrative inspired by a CNBC live-updates story about a holiday-shortened week when software shares slid; the reporting above synthesizes that theme with broader coverage from the sources listed.)


Related update: We recently published an article that expands on this topic: read the latest post.


Related update: We recently published an article that expands on this topic: read the latest post.

China Retreats: Trouble for U.S | Analysis by Brian Moineau

Why China (and other foreign buyers) might be stepping back from U.S. Treasuries — and why it matters

It started as a whisper and has the markets leaning forward: reports say Beijing has told its banks to cut back on buying U.S. Treasuries. That’s not a casual portfolio shuffle — it’s a shot across the bow of a decades‑long relationship in which the world piled cash into the dollar and U.S. debt. If foreign demand softens, it changes how the U.S. finances itself, how yields move, and how policymakers think about risk.

Below I unpack the four reasons driving the reported pullback, why the reaction so far has been measured, and what to watch next.

The short, punchy version

  • Foreign holdings of U.S. Treasuries have been declining in recent months, and China’s reserves have fallen notably year‑over‑year.
  • Four main forces appear to be nudging China and others away: geopolitics and sanctions risk, U.S. fiscal trajectory, policy unpredictability, and better alternatives abroad.
  • A true “dollar break” would be dramatic — but incremental shifts can still push yields higher, the dollar lower, and borrowing costs up for Americans.
  • Watch official reserve flows, Japanese and European yields, and any formal guidance from Beijing or large sovereign custodians.

A quick scene setter

For decades the U.S. Treasury market has been the global safe harbor: deep, liquid, and reliable. That status rests on a mix of economic fundamentals and trust in U.S. institutions. But that foundation isn’t invulnerable. Since at least 2018, China’s Treasury holdings have trended down. Recent reports — including an Axios piece highlighting “4 reasons” investors may retreat — say Beijing has asked banks to limit Treasury exposure. Treasury International Capital (TIC) and monthly flow data show foreign net purchases ebbing and occasional outright reductions from major holders like China and Japan. (axios.com)

The four big reasons behind the pullback

  1. Geopolitical and sanction risk
  • The U.S. has weaponized financial channels in recent geopolitical actions (for example, freezing some Russian reserves in 2022). That sets a precedent: reserves parked in dollar assets could be subject to policy actions. For sovereigns that see strategic competition with Washington, that is a non‑trivial risk. Investors price the possibility that access or liquidity might be constrained during political crises. (axios.com)
  1. Rising U.S. deficits and debt dynamics
  • Larger deficits mean more new Treasury issuance. That raises questions about who will absorb supply and whether yields must rise to attract buyers. Persistent fiscal gaps can make some reserve managers uneasy about long-term real returns and currency dilution risk. News coverage and Treasury data show growing U.S. issuance and investor sensitivity to fiscal signals. (cmegroup.com)
  1. Policy unpredictability and political risk
  • Sudden policy moves — tariffs, trade brinkmanship, or concerns about a politicized Fed — create uncertainty for investors. When a government’s policy environment feels unstable, reserve managers may prefer to diversify into other currencies or assets perceived as less exposed to political swings. Axios flagged policy unpredictability as a key motive in recent reports. (axios.com)
  1. Attractive alternatives and portfolio diversification
  • Other safe assets (or yield opportunities) have become more attractive. Japan, in particular, has offered periods of higher yields, and other markets or assets (corporates, agencies, gold) have drawn flows. Central banks and bank portfolios are actively optimizing risk, liquidity, and yield — not just clinging to the dollar by default. Data from TIC and market reports show net shifts toward corporate and agency paper at times. (cmegroup.com)

Why markets haven't panicked (yet)

  • Scale matters. Even a sizable reduction by China would still leave it among the largest holders — and global Treasuries remain the deepest, most liquid bond market on earth. A true exodus would require coordinated moves by many holders and a large, rapid reduction in demand. Experts caution that such a breakdown would be dramatic and visible across currencies, interest rates, and capital flows — and we haven’t seen that. (axios.com)

  • Substitution vs. sale. Some flows are about slowing new purchases or reallocating new reserves — not wholesale dumping. That nuance matters: gradual diversification increases yields slowly and predictably; sudden selling spikes volatility.

  • Domestic demand and market structure. U.S. banks, mutual funds, and pensions absorb a lot of supply. Large, liquid domestic demand reservoirs blunt the impact of lower foreign purchases.

The likely near-term consequences

  • Slight upward pressure on U.S. yields: reduced foreign buying means the U.S. may need to offer higher yields to clear markets, all else equal.
  • A softer dollar: lower foreign demand for Treasuries often accompanies less dollar demand. That can help exporters, hurt importers, and change inflation dynamics.
  • Policy second-guessing: Treasury and Fed officials will be watching flows; perceptions of fiscal stress can feed into rate and funding debates.
  • Increased attention on reserve composition: expect more diversification (gold, other sovereign bonds, FX baskets) from central banks that see political or concentration risk.

What to watch next (fast signals)

  • Monthly TIC and Treasury holdings releases for major holders (China, Japan, UK, offshore custodial accounts).
  • Moves in 10‑year Treasury yield and net foreign purchases in the TIC flows.
  • Statements or rules from China’s state banks and the People’s Bank of China about reserve allocation.
  • Relative yields in Japan and Europe — attractive alternatives could accelerate reallocation.
  • FX flows and dollar index moves.

Different ways to read this moment

  • Defensive view: This is pragmatic reserve management. China is diversifying to reduce concentration and geopolitical risk — not trying to “break” the dollar. A gradual shift is manageable and expected. (cmegroup.com)

  • Structural risk view: Repeated politicization of finance and rising global tensions undermine the implicit guarantees that made dollar assets the unquestioned safe haven. Over time, this could erode the “exorbitant privilege” of the U.S. — raising capital costs and geopolitical friction. (wsj.com)

My take

We’re seeing a careful rebalancing, not a sudden divorce. Reports that China has told banks to limit new Treasury purchases are meaningful: they reflect a smarter, risk‑aware strategy by reserve managers facing geopolitical uncertainty and a crowded U.S. bond market. But the dollar and Treasuries have considerable structural advantages that aren’t going away overnight. The real risk is complacency — if U.S. fiscal policy and political volatility intensify, what’s now a managed reallocation could become a more disruptive trend.

Final thoughts

Treat this as a warning light, not an emergency siren. Investors, policymakers, and citizens should watch flows, yields, and diplomatic signals. If foreign buyers keep nudging toward diversity, the United States will pay a little more to borrow — and the broader global financial order will slowly adapt. That’s manageable, but it’s a structural shift worth tracking.

Sources

When Treasury Declines to Protect Fed | Analysis by Brian Moineau

When the Treasury Won’t Promise: What Bessent’s “That Is Up to the President” Really Means

The one-liner that stole the hearing: “That is up to the president.” Delivered by Treasury Secretary Scott Bessent on February 5, 2026, it landed like a mic drop — and not in a good way for those who care about central bank independence. A routine Senate exchange with Sen. Elizabeth Warren became a flashpoint over whether the executive branch would tolerate a Fed chair who refuses presidential pressure to cut interest rates. The stakes? The credibility of the Federal Reserve, market confidence, and the basic separation of powers that underpins U.S. monetary policy.

Why this moment matters

  • The Federal Reserve’s independence matters because it anchors inflation expectations, helps keep markets stable, and shields monetary policy from short-term political pressure.
  • President Donald Trump nominated Kevin Warsh to be Fed chair; Trump publicly joked about suing the Fed chair if rates weren’t lowered — a comment that, even labeled a “joke,” raised alarms.
  • At a Senate Banking Committee hearing, Sen. Warren asked Bessent to commit that the administration would not sue or investigate a Fed chair for policy decisions. Bessent’s reply — “That is up to the president.” — was noncommittal and instantly newsworthy.

What happened at the hearing

  • Date: February 5, 2026.
  • Context: Questions followed the Alfalfa Club remarks in which President Trump quipped about suing his nominee if the Fed chair didn’t cut rates.
  • Exchange: Sen. Warren pressed Secretary Bessent for a clear guarantee that the Department of Justice or the administration would not pursue legal action or investigations against a Fed chair for making policy choices. Bessent declined to offer that guarantee and shrugged responsibility to the president.
  • Reaction: Lawmakers and former central bankers flagged the response as concerning, pointing to a possible erosion of norms that have long insulated the Fed from political retaliation.

Big-picture implications

  • Markets and central bank credibility

    • Even the hint that criminal or civil action could follow policy decisions undermines the Fed’s ability to act in the long-term public interest.
    • Investors prize predictability; politicizing rate-setting risks greater volatility and higher risk premia.
  • Separation of powers and precedent

    • The threat — or even the perceived threat — of prosecution for policy outcomes could blur lines between legitimate oversight and intimidation.
    • If legal action is used as a tool to enforce policy compliance, it sets a dangerous precedent for other independent agencies.
  • Practical legal questions

    • Monetary policy decisions are typically not a legal matter; prosecuting a Fed chair for failing to cut rates would require creative legal theories that have never been tested and that many legal scholars call frivolous or politically motivated.
    • Using law enforcement to police policy disagreements would likely invite protracted court fights, adding policy uncertainty rather than clarity.

Quick takeaways

  • Noncommittal answers from top officials can be as destabilizing as explicit threats. Saying “that is up to the president” leaves markets and the public guessing about red lines.
  • Protecting central bank independence is not just a lofty norm — it’s practical economic infrastructure. When independence erodes, inflation and lending outcomes can suffer.
  • Institutional checks (Congressional oversight, courts, and public scrutiny) become more important when norms fray. But courts move slowly; markets move fast.

My take

The exchange felt like a cautionary tale about how fragile institutional norms can be when tested by political theater. Whether or not the president intended the Alfalfa Club joke to be taken literally, the administration’s failure to rule out legal retaliation opened a credibility gap. Fed independence is not a relic; it is a pragmatic tool that helps keep inflation in check and the economy steady. Leaders who respect that boundary — explicitly and repeatedly — help markets and citizens plan for the future. Ambiguity does the opposite.

Sources


Related update: We recently published an article that expands on this topic: read the latest post.

Related update: We recently published an article that expands on this topic: read the latest post.


Related update: We recently published an article that expands on this topic: read the latest post.

Bowman’s 2026 Fed Outlook: Calm Caution | Analysis by Brian Moineau

Reading the Fed’s Signals: Bowman’s January 16, 2026 Outlook on the Economy and Monetary Policy

Good morning at the conference table of the mind: imagine the Federal Reserve’s meeting notes as a weather report for the economy. On January 16, 2026, Vice Chair for Supervision Michelle W. Bowman stepped up in Boston and delivered a forecast that felt less like thunder and more like watching the clouds: inflation easing, but a labor market growing fragile — and policy makers watching both closely. Her remarks at the New England Economic Forum are a practical, plainspoken reminder that the Fed’s job is often about balancing calm and caution.

Why this speech matters

  • The speaker is Michelle W. Bowman, Vice Chair for Supervision of the Federal Reserve Board — a policymaker with a voting role on the FOMC and direct responsibility for bank supervision.
  • The talk comes at a moment of transition: after several rate cuts in late 2025, inflation readings looking better once one-off tariff effects are stripped out, and early signs that hiring is weakening.
  • Bowman’s emphasis: inflation seems to be moving toward the Fed’s 2% goal, but a fragile labor market raises downside risk — and that should shape monetary policy decisions.

Highlights from Bowman’s outlook

  • Recent policy changes: the Fed lowered the federal funds target range by 75 basis points since September 2025 (three 25-basis-point cuts), bringing the range to 3.50–3.75%. Bowman voted for those cuts, viewing policy as moving toward neutral.
  • Inflation narrative: headline and core PCE inflation have fallen, and when estimated tariff impacts are removed, core PCE looks much closer to 2%. Core services inflation has eased in particular; remaining pressure is concentrated in core goods, which Bowman expects to moderate as tariff effects fade.
  • Labor market concern: hiring rates are low and payroll growth has flattened; with layoffs not yet widespread, the labor market could still deteriorate quickly if demand softens. Bowman views the labor-market downside as the larger near-term risk.
  • Policy stance and approach: Bowman favors a forward-looking, data-informed strategy — ready to adjust policy to support employment if labor fragility worsens, while noting policy is not on a preset course.
  • Supervision agenda: as Vice Chair for Supervision, Bowman also highlighted regulatory priorities — rationalizing large-bank ratings, improving M&A review processes, and implementing the GENIUS Act responsibilities on stablecoins.

The investor and business dilemma

  • For businesses: easing inflation can reduce input-cost pressure, but softer hiring and potentially weaker demand mean firms should be cautious about growth plans and workforce commitments.
  • For investors: the combination of lower inflation risk and a fragile labor market suggests the Fed is unlikely to pivot aggressively. Markets should prepare for gradual adjustments rather than dramatic rate swings, with a watchful eye on employment indicators.

What to watch next

  • Monthly payrolls and the unemployment rate — signs of a pickup in layoffs or a sharper rise in unemployment would increase the Fed’s focus on supporting employment.
  • Core PCE inflation excluding tariff adjustments — Bowman explicitly treats tariff effects as one-offs; if core goods inflation doesn’t continue to soften, that would complicate the 2% story.
  • Business hiring intentions and consumer demand measures — weak demand would reinforce Bowman’s caution about labor-market fragility.
  • Fed communications at upcoming FOMC meetings — Bowman emphasized that policy is not on autopilot and that the Committee will weigh new data meeting by meeting.

A few practical takeaways

  • Expect policy to remain “patient but ready”: the Fed’s stance is moderately restrictive but responsive to incoming data.
  • Companies should build flexibility into hiring and capital plans — layering contingent plans (e.g., phased hiring, temporary contracts) reduces risk if demand softens.
  • Bond and equity investors should monitor real-time labor and inflation indicators rather than relying solely on past rate moves.

My take

Bowman’s speech reads as pragmatic: credit the Fed for recognizing progress on inflation while honestly calling out the economy’s weak spots. The emphasis on labor-market fragility is a useful corrective to narratives that celebrate disinflation as a finished project. Policymaking in 2026 looks set to be a juggling act — steadying inflation without worsening employment — and Bowman’s call for forward-looking, data-driven decisions is the kind of steady voice markets and Main Street need right now.

Sources


Related update: We recently published an article that expands on this topic: read the latest post.
Five Market Moves Investors Must Know | Analysis by Brian Moineau

Morning market pulse: five things investors should know before the bell

The market opens like a morning radio dial: a few headlines, a surprise on the tape, and suddenly portfolio emotions are humming. Today’s mix feels like that—economic growth that surprised, a regulatory pause that eases tech pressure, a fresh S&P milestone, and the usual questions about where bond yields and inflation fit into the picture. Below are the five things investors should keep front of mind as trading starts.

Quick hits for busy investors

  • U.S. economic growth came in stronger than many anticipated, giving risk assets a tailwind. (apnews.com)
  • Washington pushed back on near-term chip tariffs, a welcome reprieve for technology and manufacturing supply chains. (reuters.com)
  • The S&P 500 hit a new record as investors leaned into tech and rate-cut hopes. (reuters.com)
  • Bond yields and inflation data remain the variables that could change the narrative quickly. (apnews.com)
  • Market breadth matters: record highs driven by a few mega-cap winners can mask underlying fragility. (reuters.com)

1. Growth surprised — but read the fine print

Headline GDP growth beat street expectations, and that’s the kind of number that wakes traders up. Strong consumption and corporate spending pushed the headline higher, which supports the bullish case for equities. But a word of caution: growth beats can be two-edged. They may lift risk assets today while also reinvigorating inflation worries that could impede Fed easing later. Watch incoming inflation gauges and labor data closely; they’ll tell you whether this growth is durable or transitory. (apnews.com)

2. The chip-tariff delay is a tactical win for tech — strategic questions remain

Regulators have delayed implementing higher tariffs on certain semiconductor imports, which eases an immediate cost shock for chip-hungry industries. For firms running supply-constrained production schedules, that delay reduces near-term margin pain and lowers the risk of disrupted product roadmaps. But delaying a tariff is not the same as solving supply-chain fragility or the long-term strategic competition over semiconductors. Expect companies to use the breathing room to update guidance — and watch capex plans for evidence of longer-term reshoring or diversification. (reuters.com)

3. S&P keeps climbing — concentration risk is real

A new S&P 500 record tells us investors are confident, particularly about large-cap tech leaders and AI beneficiaries. Yet records driven by a cluster of mega-cap names raise the question of breadth: are most companies participating, or is market performance concentrated? When indices rally on a handful of stocks, risk is asymmetric — a shock to the leaders can amplify index pain. Portfolio tilt matters: if you’re overweight the rally leaders, consider whether your position sizing and stop-loss rules reflect the elevated correlation risk. (reuters.com)

4. Rates, yields and the Fed calendar still run the show

Even with strong GDP and a tariff pause, markets are sensitive to the path of interest rates. Recent moves show investors pricing in eventual rate cuts, which supports equities and higher multiple expansion for growth stocks. But if inflation re-accelerates or payrolls surprise to the upside, the Fed’s stance could stay firmer for longer — and that would pressure risk assets. Keep an eye on ten-year yields, the upcoming inflation prints, and any Fed commentary for clues on timing and magnitude of policy shifts. (reuters.com)

5. Earnings, guidance and sentiment will determine whether this is a rally or a run-up

Macro headlines move markets intraday, but corporate results and management commentary steer the trend. Better-than-expected revenue and margin outlooks will sustain optimism; cautious guidance could snap momentum. Also watch investor sentiment indicators — flows into and out of equities, options skew, and credit spreads — because they reveal whether participants are buying the rally or hedging against it. (reuters.com)

My take

We’re in a market that rewards conviction but punishes complacency. The mix of stronger growth and a regulatory pause is a constructive backdrop for stocks — especially tech — but it also raises the stakes on inflation and Fed expectations. For investors, that suggests a balanced posture: respect the rally, but keep risk controls in place, diversify across themes that can outperform in both a slower and a faster growth environment, and stay nimble around data releases. Position sizing and active monitoring matter more now than ever.

Sources


Related update: We recently published an article that expands on this topic: read the latest post.


Related update: We recently published an article that expands on this topic: read the latest post.

S&Ps Three-Day Win: Calm or Pause? | Analysis by Brian Moineau

When a Three-Day Win Streak Feels Both Comforting and Fragile

The market closed on a gentle high — the S&P 500 notched its third straight winning session, led by another surge in Nvidia and broad gains across the market. But the calm in stock futures after that three-day run felt more like a pause than a parade: futures were largely flat as investors digested whether the rally has momentum or is simply a holiday-season reprieve.

Quick snapshot

  • The S&P 500 recorded a third consecutive winning session, buoyed by gains in big tech, especially Nvidia.
  • Ten of 11 S&P sectors rose in the session, signaling breadth beyond the usual handful of leaders.
  • Stock futures traded around the flatline after the close, suggesting traders were taking profits or waiting for fresh data and earnings catalysts.

Why this small, steady move matters

Markets don’t always need dramatic headlines to move meaningfully. A three-day winning streak — particularly when it comes with broad sector participation — tells us a few practical things:

  • Market sentiment is constructive. When 10 out of 11 sectors are positive, it isn’t just a narrow tech rally; money is rotating into cyclicals, financials or other pockets as well. That’s a healthier profile for a sustainable advance.
  • Big-cap leadership still matters. Nvidia’s gains have outsized influence on the indexes. When a giant like NVDA moves materially, it can lift the S&P and Nasdaq even if smaller names are mixed.
  • Flat futures after gains can mean caution. Futures trading little changed overnight suggests traders want more clarity — upcoming earnings, economic data, or central bank signals — before pushing the next leg higher.

The backdrop: what investors were weighing

  • Economic signals: Consumer confidence and some “soft” indicators have been mixed — people report feeling less optimistic even as many hard data points (industrial production, housing starts on different days) have surprised to the upside. The disconnect keeps investors guessing about the outlook for growth and inflation.
  • Fed expectations: Any tug-of-war around the timing and scale of Fed rate cuts or pauses is market-moving. If markets increasingly expect cuts, that can sustain rallies; if the data suggests stickier inflation, rallies can stall.
  • Earnings and corporate action: Big company moves — earnings beats, guidance changes, or corporate decisions like buybacks and unusual investments — can quickly change index dynamics. Case in point: Nvidia’s headlines and other large-cap moves often ripple across sector flows.

What to watch next

  • Upcoming economic releases: durable goods, inflation reads, and jobs-related numbers will re-shape Fed expectations and market sentiment.
  • Earnings calendar: a number of companies (including smaller caps and midcaps) reporting can either extend the rally or expose cracks beneath the headline indexes.
  • Leadership breadth: if the rally continues with more sectors participating and small- and mid-caps joining, it’s more robust. If gains narrow back to megacaps, risk of a short-term pullback rises.

Market mood in plain language

Think of this rally like a group hike. The S&P managed three steady steps up the trail with most of the group keeping pace — that’s encouraging. But the guides (futures traders) stayed at the next ridge, scanning the horizon. They’re not sprinting forward yet. They want clarity: will the weather (economic data) hold? Are there dangerous patches ahead (inflation surprises, disappointing earnings)? Until they see it, the pace is cautious.

A few tactical notes for investors (not advice, just common-sense points)

  • If you’re long-term focused, broad participation is encouraging; keep concentrates in line with your plan.
  • If you’re trading shorter term, watch leadership shifts and volume — rallies on thin volume are more fragile.
  • Use upcoming data releases and earnings as checkpoints to reassess exposure, not as triggers for emotionally driven trades.

My take

A three-day win streak with 10 of 11 sectors up is a welcome sign of market health, but the tepid action in futures after the close shows that conviction isn’t universal. Big tech — and Nvidia in particular — remains the fulcrum. For investors, that means celebrating breadth when it appears, but staying disciplined: watch the data, watch leadership, and let conviction build from multiple confirmations rather than one flashy headline.

Sources


Related update: We recently published an article that expands on this topic: read the latest post.


Related update: We recently published an article that expands on this topic: read the latest post.

Rising Unemployment Roils Trump’s Economic | Analysis by Brian Moineau

When the jobless rate climbs, a political narrative starts to wobble

There’s a particular hum in Washington when a jobs report walks in slightly off-script: markets twitch, talking heads adjust their tone, and political teams scramble for new soundbites. The headline from mid-December was blunt — the unemployment rate rose, even as the economy added a modest number of jobs — and that small shift has outsized implications for an administration that has made “economic comeback” central to its pitch to voters.

Below I unpack why a rising jobless rate matters politically, what’s driving the softening labor market, and why this is more than just a numbers game.

What happened — the quick version

  • In the latest Labor Department snapshots, the unemployment rate ticked up to the mid-4 percent range (reports around the December jobs release put it at roughly 4.6% for November), while payroll gains were modest. (wsj.com)
  • Revisions and one-off cuts — notably large reductions in federal payrolls earlier in the year — have removed a cushion that previously helped headline job growth. (washingtonpost.com)
  • Other indicators — weaker hiring in manufacturing and finance, slower wage growth, and falling private job openings — point to a labor market that’s cooling rather than collapsing. (businessinsider.com)

Why this stings Trump’s economic messaging

  • The core of the Trump message has been: my policies deliver jobs and rising incomes. Voters notice the jobless rate more than they notice GDP nuance. A rising unemployment rate is a visceral, easy-to-grasp signal that “the economy isn’t working for people.” (politico.com)
  • Politics is about attribution. When unemployment climbs, the incumbent is the default target; opponents and the press will link labor weakness directly to administration choices — tariffs, federal workforce cuts, and policy uncertainty — even if causes are mixed. (americanprogress.org)
  • Messaging mismatch: The White House can point to private-sector gains and labor-force entrants as explanations, but those arguments are weaker if people feel longer job searches, slower pay growth, or layoffs in local industries. Numbers that look small in D.C. spreadsheets translate to real pain on Main Street. (whitehouse.gov)

What’s behind the shift in the labor market

  • Policy headwinds: Tariff uncertainty and trade policy shifts have raised costs for some manufacturers and importers, prompting hiring freezes or cuts in certain sectors. (businessinsider.com)
  • Federal payroll reductions: Large federal workforce cuts earlier in the year removed a steady source of employment and ripple effects into the private firms that depend on government contracts. (washingtonpost.com)
  • Monetary legacy and demand cooling: The Federal Reserve’s earlier cycle of high interest rates and their lagged effects are still tamping down investment and hiring in interest-sensitive sectors. That, plus slower wage growth, reduces hiring incentives. (ft.com)
  • Structural changes: Automation, AI adoption, and shifting sectoral demand mean some occupations face lasting disruption, complicating the short-term picture. (businessinsider.com)

Voter dynamics and the election arithmetic

  • Timing matters. If the labor market continues to weaken heading into an election year, skepticism about economic stewardship becomes a tangible drag. Voters who once prioritized pocketbook improvements are quicker to notice higher joblessness and slower hiring. (politico.com)
  • The administration can still shape the narrative (point to private-sector job creation, rising participation, or short-term payroll gains), but repetition works only so long if local experiences tell a different story. Campaigns that rely on economic credibility are particularly vulnerable to a steady, measurable rise in unemployment. (whitehouse.gov)

What to watch next

  • Monthly Labor Department jobs reports and revisions: small headline changes can have big political effects once they stack into a trend. (wsj.com)
  • Federal employment and contract dynamics: more cuts or restorations will directly affect regions and industries that provide campaign reach. (washingtonpost.com)
  • Wage trends and jobless-duration metrics: growing spell lengths or falling real wages are the signals that sway everyday voters more than the unemployment number alone. (wsj.com)
  • Fed policy shifts: if the Fed moves aggressively on rates, it will change the trajectory of hiring and investment, with clear political consequences. (ft.com)

Quick takeaways

  • A rising unemployment rate punches above its weight politically — it’s shorthand for “economy not delivering.” (wsj.com)
  • Policy choices (tariffs, federal cuts) and lingering monetary effects are combining with structural labor shifts to cool hiring. (americanprogress.org)
  • The administration can frame the data in ways that defend its record, but sustained labor-market deterioration would make persuasive messaging much harder. (politico.com)

My take

Numbers move markets, but narratives move voters. A single uptick in unemployment doesn’t end a presidency. But in politics, perception is cumulative: a steady string of softer labor reports can erode the economic credibility that incumbents depend on. For an administration that’s built a central narrative around jobs and prosperity, the safe play is twofold — stabilize the labor market with clear, targeted policy and lay out an honest, localized story that connects policy moves to tangible results for working people. Spin only stretches so far when someone in your town has been looking for work longer than they used to.

Sources

(Note: URLs above are non-paywalled where available; some outlets may require free registration.)


Related update: We recently published an article that expands on this topic: read the latest post.


Related update: We recently published an article that expands on this topic: read the latest post.

Fed’s Small Cut, Big Year of Uncertainty | Analysis by Brian Moineau

A small cut, big questions: why the Fed’s December move matters more than the math

The Federal Reserve is set to act this week — widely expected to shave 25 basis points off its policy rate at the December 9–10 meeting — but the decision feels less like a crisp policy pivot and more like a weather forecast for a very foggy year ahead. Markets are pricing the cut as likely, yet Fed officials remain sharply divided about what comes next. That tension is the real story: a “hawkish cut” that eases today while signaling caution about tomorrow. (finance.yahoo.com)

Why this cut is different

  • It’s small and tactical: officials are likely to cut by 0.25 percentage points — a modest easing intended to support a slowing labor market rather than to ignite growth. (finance.yahoo.com)
  • It’s politically and institutionally noisy: unusually high numbers of dissents and public disagreement among Fed officials have surfaced, weakening the usual appearance of consensus. (wsj.com)
  • It’s defensive, not directional: the messaging is expected to emphasize that further cuts are not guaranteed and will depend on incoming data, especially payrolls and inflation signals. That is the essence of a “hawkish cut.” (finance.yahoo.com)

What led the Fed to this crossroads

Over the past year the Fed has moved from aggressive tightening (to fight high inflation) to cautious easing as jobs growth cooled and signs of economic slowing mounted. With inflation still above target in some measures and the labor market showing cracks, policymakers face two conflicting risks: easing too much could reignite inflation; easing too little could let a slowdown deepen into a recession. That trade-off explains why the Fed looks divided going into the meeting. (wbtv.com)

  • Labor market softness has become a central worry — slowing hiring and rising unemployment risk a broader slowdown. (wbtv.com)
  • Inflation remains a lingering concern, meaning many officials are reluctant to commit to a path of multiple cuts. (wbtv.com)

How markets will read the move

Expect three distinct market reactions depending on the Fed's communication:

  1. “Hawkish cut” narrative — Fed cuts now but signals a pause: short-term yields fall, risk assets rally modestly, but the rally is contained because the door for further easing is left mostly shut. This is the scenario many strategists expect. (finance.yahoo.com)
  2. Clear easing path signaled — Fed telegraphs additional cuts: bond yields and the dollar drop further, and equities get a stronger lift. Unlikely given current internal divisions but possible if data deteriorates. (reuters.com)
  3. Mixed message or large dissent — uncertainty spikes, volatility rises, and markets trade on headline interpretation rather than on concrete guidance. The Fed’s historic preference for consensus makes any multi-dissent outcome notable. (wsj.com)

CME Fed funds futures currently put a high probability on a 25 bps cut this week, but the outlook for January and beyond is much murkier — traders assign materially lower odds to a sustained easing cycle. That mismatch between near-term pricing and medium-term uncertainty is what creates the “year of unknowns.” (finance.yahoo.com)

What to watch in the Fed’s statement and Powell’s press conference

  • Language around “neutral” or “restrictive” policy: small wording shifts will be parsed for signs of more cuts. (wsj.com)
  • References to the labor market and downside risks to employment: clear talk of deterioration would open the door to additional easing. (wbtv.com)
  • Any explicit guidance on the balance sheet or Treasury bill purchases: the Fed might use Reserve Management Purchases (RMP) or other tools to manage liquidity — an outcome that could surprise markets beyond the headline rate cut. (reuters.com)

What this means for everyday borrowers, savers, and investors

  • Borrowers: A 25 bps cut can ease some short-term borrowing costs (credit cards, some variable-rate loans), but mortgage rates and longer-term borrowing are more sensitive to broader yield moves and inflation expectations, so homeowners may see only modest relief. (finance.yahoo.com)
  • Savers: Any improvement in savings rates will likely be gradual; banks don’t always pass every Fed cut through to deposit rates. (finance.yahoo.com)
  • Investors: Volatility is the likely constant. Strategies that focus on quality, cash flow, and duration management will generally fare better than high-beta short-term plays in an uncertain policy regime. (finance.yahoo.com)

Quick wins for readers who want to navigate the uncertainty

  • Keep an eye on jobs, inflation, and Fed communications — those three datapoints will steer the odds for any further cuts. (wbtv.com)
  • Reassess duration exposure in fixed-income portfolios: small cuts can lower short-term yields quickly but have a less predictable effect on long-term rates. (reuters.com)
  • For households, prioritize emergency savings and fixed-rate borrowing if you expect rates to drift unpredictably. (finance.yahoo.com)

Final thoughts

A rate cut this week would be a pragmatic, defensive step: the Fed is trying to support a labor market that looks wobbly without declaring a new era of accommodative policy. But the split among policymakers matters. When a central bank is divided, its future path is harder to forecast — and that uncertainty can ripple through markets and everyday decisions more than the quarter-point itself. In short: the math of a 25 bps cut is simple; the message the Fed sends afterward is what will determine whether 2026 becomes steadier or more unsettled. (finance.yahoo.com)

What I’m watching next

  • The Fed’s statement and Chair Powell’s December 10 press conference for clues about the January meeting and balance-sheet tools. (finance.yahoo.com)
  • December labor-market releases and inflation prints for signs that could prompt either more easing or a pause. (wbtv.com)

Notes for readers

  • The Fed meeting dates are December 9–10, 2025; markets and commentators are highly focused on both the rate decision and the tone of the Fed’s forward guidance. (finance.yahoo.com)

Sources


Related update: We recently published an article that expands on this topic: read the latest post.


Related update: We recently published an article that expands on this topic: read the latest post.

Bond Traders Challenge Fed Credibility | Analysis by Brian Moineau

When Bond Traders Ignore the Fed: A Dinner-Table Argument for Markets and Democracy

The financial world loves a paradox: the Federal Reserve cuts its policy rate, signaling easier money, yet long-term Treasury yields climb instead of falling. That’s exactly what’s happening now — and it’s touching off a heated debate that’s part market mechanics, part politics, and entirely consequential for anyone who pays a mortgage, runs a business, or watches Washington.

(finance.yahoo.com)

Why this feels like a grab for attention

  • The Fed has been easing from highs set in 2024, cutting the federal funds target by roughly 1.5 percentage points so far. Traders expect more cuts. Yet 10- and 30-year Treasury yields have moved higher, not lower. That mismatch is uncommon outside of certain episodes in the 1990s and has market strategists scratching their heads. (finance.yahoo.com)

  • The timing is politically charged: President Trump will soon be able to nominate Jerome Powell’s replacement, and market participants are already debating what a politically aligned Fed chair could mean for inflation, credibility, and long-term borrowing costs. Fear: a Fed that caves to pressure to ease too far could stoke inflation and push yields even higher. (finance.yahoo.com)

The competing explanations (pick your favorite)

  • A hopeful reading: Rising long-term yields reflect confidence. Investors expect stronger growth and lower recession risk, so they demand less duration protection — higher yields are a payoff for an economy that’s not collapsing. (finance.yahoo.com)

  • A structural adjustment view: Some say this is a return to pre-2008 market norms — less central-bank dominance, markets pricing in real macro variables (growth, fiscal stance, term premium) rather than simply shadowing policy rates. (finance.yahoo.com)

  • The bond vigilante scenario: Creditors are worried about a swelling U.S. debt burden and a politically compromised Fed. If traders think the central bank will prioritize short-term political goals over price stability, they’ll demand higher yields as compensation for future inflation or fiscal risk. That narrative has gained traction as talk of a political appointee to the Fed intensifies. (finance.yahoo.com)

What’s at stake for ordinary people

  • Mortgage rates and car loans are tied to long-term Treasury yields. If 10- and 30-year yields keep rising despite Fed cuts, borrowing costs for consumers may not fall the way policymakers (or politicians) promise. That matters for home affordability, corporate investment, and the pace of the economy. (finance.yahoo.com)

  • Fed credibility is monetary gold. If the public and markets lose faith that the Fed will fight inflation when needed — or that it can resist political pressure — the central bank’s ability to anchor expectations weakens. That can make inflation higher and more volatile over time, which is costlier than short-term stimulus. (reuters.com)

The investor dilemma

  • Short-term returns vs. long-term risks: Traders must choose whether to interpret rising yields as a buying opportunity (if growth stays firm) or a warning sign (if fiscal or political pressures push inflation and rates up). Both choices carry real pain if the signal is wrong. (finance.yahoo.com)

  • Pricing the unknown Fed nominee: Markets are trying to price not only macro data but also political risk — how dovish will the next chair be, and how independent? That uncertainty is adding a term premium to bonds that doesn’t move in lockstep with the Fed’s policy path. (reuters.com)

How policymakers and politicians look from here

  • For the Fed: this is a test of independence. Cuts are a tool; credibility is the asset that makes those tools work predictably. If markets perceive cuts as politically driven rather than data-driven, the policy channel frays. (finance.yahoo.com)

  • For the White House: pushing for lower long-term rates via political influence on the Fed is a high-risk play. Even if the administration succeeds in appointing a friendly chair, markets may still demand a premium for perceived fiscal looseness or higher inflation risk, undermining the intended effects. (finance.yahoo.com)

What to watch next

  • Moves in the 10-year and 30-year Treasury yields relative to Fed fund futures pricing. If yields keep diverging from the expected policy path, risk premia or fiscal concerns are probably doing the heavy lifting. (finance.yahoo.com)

  • Inflation data and the Fed’s language. Concrete signs of sticky inflation together with more politically charged rhetoric around appointments will deepen market uncertainty. (reuters.com)

  • Nomination news. Who the White House nominates and how markets and Treasury investors react will shape the credibility story. Early market pushback — as reported in recent investor outreach to the Treasury — already signals concern. (reuters.com)

Some practical thinking for readers

  • If you have a mortgage or plan to borrow, don’t count on big rate relief simply because the Fed is cutting short-term rates. Long-term yields matter. (finance.yahoo.com)

  • For investors: be mindful of duration risk and the possibility that a rising-term premium could pressure long-duration portfolios even as short-term rates fall. Diversification and scenario planning matter more when political risk enters the monetary policy mix. (finance.yahoo.com)

Final thoughts

We’re watching a classic tug-of-war between central-bank tools and market psychology. When bond traders “defy” the Fed, they’re not staging a conspiracy — they’re signalling uncertainty about growth, inflation, fiscal health, and yes, political influence. If the Fed wants the trust that makes policy moves effective, it needs to prove its independence; if politics tries to bend the central bank into short-term aims, the cost will likely show up where it hurts most: in the price of money for everyday Americans.

(finance.yahoo.com)

Sources


Related update: We recently published an article that expands on this topic: read the latest post.


Related update: We recently published an article that expands on this topic: read the latest post.


Related update: We recently published an article that expands on this topic: read the latest post.

Indias Growth Surge: Factories Fuel Boom | Analysis by Brian Moineau

India’s GDP Surprise: Factories, Festivals and a Fed of Optimism

Prime Minister Narendra Modi called the GDP number “very encouraging.” And who wouldn’t be? When official data showed India’s economy growing faster than most forecasters dared to predict, the reaction was equal parts relief and recalibration — for businesses, policymakers and investors trying to read what comes next.

Why this quarter felt different

  • India’s GDP surged 8.2% year‑on‑year in the July–September 2025 quarter, well above Bloomberg and consensus forecasts and the strongest pace in six quarters. (fortune.com)
  • The upswing was broad-based: private consumption jumped ahead of the festival season, manufacturing posted a sharp gain, and services remained resilient. Policy moves — tax cuts in September and a series of earlier rate reductions — helped juice demand. (fortune.com)
  • All of this happened while a strained trade backdrop loomed: a 50% U.S. tariff on many Indian imports complicates export prospects and adds uncertainty to the near term. Yet firms appear to have front‑loaded shipments and inventory activity, muting the immediate bite of tariffs. (fortune.com)

What the numbers really tell us

  • Short-term momentum: The combination of festive-season spending, tax cuts and prior interest‑rate easing produced a powerful near‑term boost. Manufacturing growth (9.1%) and a near‑8% jump in private consumption are the headline engines of the quarter. (fortune.com)
  • Not necessarily durable: Several economists warn the gains may fade once the one‑off effects — stockpiling before tariffs, festival demand, and statistical quirks like a lower GDP deflator — wash out. Forecasts for next fiscal year were nudged up, but multilateral institutions and rating agencies still flag downside risks if trade frictions persist. (fortune.com)
  • Policy implications: Strong growth reduces the urgency for an immediate rate cut by the Reserve Bank of India, though low inflation keeps room for easing open. Markets reacted by pricing a lower probability of an imminent cut. (fortune.com)

A closer look at the Trump tariffs effect

  • Timing matters: Many exporters shipped ahead of August’s tariff implementation, which created a temporary volume bump. That front‑loading shows up in the data, helping manufacturing and export‑related activity this quarter. (fortune.com)
  • Structural risk remains: If high U.S. tariffs endure, exporters will face sustained price and market‑access penalties. Multilateral forecasts (IMF WEO and Article IV assessments) reduced long‑run growth projections slightly under a scenario of prolonged tariffs. India’s domestic demand cushion can blunt but not fully negate export pain. (imf.org)
  • Winners and losers: Sectors with strong domestic market exposure (consumer goods, some services, domestic manufacturing) benefit most from the current setup. Labor‑intensive export sectors — textiles, gems and jewelry, seafood — are more exposed to tariff damage. (forbes.com)

When numbers and politics collide

  • Messaging matters: Modi’s “very encouraging” post on X is more than cheerleading. Strong quarterly prints bolster the government’s reform story (tax cuts, Make in India push) and strengthen negotiating leverage in trade talks. But politics also raises the bar for sustaining results; the state wants growth to look both robust and inclusive. (fortune.com)
  • External perceptions: International agencies still see India as one of the few bright spots in a slower world economy, even if they temper longer-term forecasts because of protectionist shocks. That positioning attracts capital and attention — until and unless trade barriers start redirecting supply chains away from India. (imf.org)

Practical implications for readers

  • For consumers: Strong demand helped by tax cuts means fresher buying power now, especially in urban centers during festival cycles. But keep an eye on inflation and employment signals over the next two quarters.
  • For business leaders: Don’t over‑interpret one robust quarter. Use the breathing room to invest in productivity, diversify export markets, and avoid over‑reliance on short‑term stockpiling gains.
  • For investors: Macro momentum and lower inflation create a constructive backdrop, but tariff‑driven export risk and potential capital flow swings mean selective exposure and active risk management make sense.

A few smart caveats

  • Some part of the headline jump may reflect statistical effects (lower GDP deflator and other discrepancy adjustments), so analysts are rightly cautious about extrapolating this pace forward. (fortune.com)
  • Forecasts vary: While the IMF projects India to remain a top growth performer in 2025–26 under its baseline, it also warns that sustained high tariffs shave projected growth thereafter. (imf.org)

My take

This quarter feels like a tactical win for India: policy levers and private consumption combined to outpace expectations, and manufacturing showed welcome life. But the strategic contest is just beginning. If India wants manufacturing-led, export‑driven growth to be durable, it needs two things: (1) trade diplomacy and adaptation to reclaim lost market access, and (2) faster local value‑chain deepening so that front‑loaded shipments don’t become the main growth story. Short of that, domestic resilience will keep India growing, but the trajectory will be bumpier than a single headline number suggests.

The bottom line

An 8.2% print is newsworthy and politically powerful. It buys space for reforms and investment. But read it as a strong quarter, not a guarantee of uninterrupted acceleration. The next few quarters — how tariffs play out, whether festival demand normalizes, and whether investment follows consumption — will tell us whether this was a steppingstone or a spike.

Sources


Related update: We recently published an article that expands on this topic: read the latest post.


Related update: We recently published an article that expands on this topic: read the latest post.


Related update: We recently published an article that expands on this topic: read the latest post.

Fed Split Drives Sudden Market Rally | Analysis by Brian Moineau

Stocks Rally as Rate-cut Odds Soar: Why a Single Fed Voice Moved Markets

Markets can be moody, and on November 21, 2025 they were downright fickle. One speech from a senior Fed official — New York Fed President John Williams — was enough to flip investor sentiment, send stocks higher and reprice the odds of a rate cut at the Fed’s December meeting. But the story isn’t just about a single quote; it’s about how fragile market expectations have become and why investors now have to navigate a Fed that sounds increasingly divided.

An attention-grabbing moment

  • In prepared remarks delivered at a Central Bank of Chile event on November 21, 2025, John Williams said he “still see[s] room for a further adjustment in the near term” to move policy closer to neutral.
  • Markets reacted fast: major indexes rallied intraday (the Dow, S&P 500 and Nasdaq all jumped), bond yields fell and CME Group’s FedWatch tool sharply increased the probability priced in for a 25-basis-point cut at the December 9–10 Fed meeting. (forbes.com)

That single dovish tilt — from a Fed official who sits permanently on the Federal Open Market Committee — was enough to reverse a recent shift toward pausing further easing. But Williams’ view wasn’t unanimous inside the Fed: other officials publicly backed holding rates steady for now, keeping uncertainty high. (forbes.com)

Why Wall Street cared so much

  • Expectations rule short-term flows. Futures and options markets move quickly when a credible policymaker signals a change. Williams is influential; his willingness to countenance another cut pushed traders to reprice December odds aggressively. (forbes.com)
  • Rate-sensitive sectors react fast. Homebuilders, gold, and consumer discretionary names — equities that benefit when borrowing costs fall — saw notable gains as investors positioned for easier policy. Technology and cyclical names that had previously weathered a hawkish Fed also saw rotations. (investopedia.com)
  • Bond markets set the backdrop. Treasury yields fell on the news, reflecting both the revised odds of policy easing and a quick move toward safer, lower-yield pricing. That in turn supports equity valuations by lowering discount rates for future earnings. (mpamag.com)

The Fed’s internal tension

  • Williams emphasized the labor market softness and said upside inflation risks had “lessened somewhat,” arguing there’s room to nudge policy toward neutral. But other officials and many market analysts remained cautious, pointing to still-elevated inflation readings and patchy labor data as reasons to hold steady. (forbes.com)
  • The result is a split Fed narrative: a powerful, market-moving voice saying “near-term cut possible,” and several colleagues advocating patience. That split creates whipsaw risk — big moves when each new datapoint or comment arrives.

What investors should watch next

  • The December 9–10 FOMC meeting calendar date. Markets have reweighted odds, but a true signal will come from Fed communications and incoming data between now and the meeting. (investopedia.com)
  • Labor-market indicators. Williams flagged downside risks to employment; if payrolls and wage growth weaken, the Fed’s tolerance for cuts grows. Conversely, stronger-than-expected job prints or stubborn inflation would swing the pendulum back. (forbes.com)
  • Fed rhetoric cohesion. Look for whether other Fed officials echo Williams’ tone or double-down on restraint. If the Fed’s public messaging becomes more uniform, the market’s volatility should ease. If the split persists, expect continued intra-day reversals. (finance.yahoo.com)

What this means practically:

  • Portfolio positioning may tilt toward rate-sensitive sectors if cuts look probable, but the risk of being wrong is real — a single stronger data release could flush those positions.
  • Volatility will remain elevated while the Fed’s internal debate plays out and the economic data stream remains mixed.

Quick takeaway points

  • A single influential Fed official can materially shift market expectations; John Williams’ “near-term” comment on Nov 21, 2025 did exactly that. (forbes.com)
  • Markets now price a much higher chance of a December rate cut, but the Fed is not united — several officials have favored maintaining current rates. (reuters.com)
  • Incoming labor and inflation data, plus the Fed’s subsequent communications, will determine whether this rally has legs or is a short-lived repricing.

My take

This episode is a reminder that markets trade not only on data but on narratives. A narrative shift — in this case, that the Fed might ease sooner — can drive swift, meaningful reallocation across assets. For investors, the sensible middle path is to respect the potential for policy easing while protecting against the opposite outcome. In practice, that means balancing exposure to assets that benefit from looser policy with hedges or sizing discipline in case the Fed leans back into restraint.

Sources

(Note: the Forbes story that prompted this piece ran on November 21, 2025; Reuters and Investopedia provide non-paywalled coverage and context cited above.)


Related update: We recently published an article that expands on this topic: read the latest post.


Related update: We recently published an article that expands on this topic: read the latest post.

S&P Dips as ADP Flags Cooling Jobs Market | Analysis by Brian Moineau

S&P slips, ADP signals softer jobs market — live market mood

The mood on Wall Street this week felt like a weather shift: one moment clear, the next a heavy cloud of caution rolling in. The S&P 500 nudged lower as investors processed the latest ADP private-payrolls read — a number that, while not catastrophic, reinforced the view that the labor market is cooling. That subtle shift is enough to make traders rethink risk, tech valuations and how fast the Fed might move next.

What happened (quick snapshot)

  • ADP’s October private-payrolls report showed a modest gain of about 42,000 jobs on November 5, 2025, a bounce after a couple of weak months but still a far cry from the pace seen earlier in the year.
  • The S&P 500 slipped on the news while the Nasdaq and Dow showed mixed action as investors weighed weaker labor momentum against pockets of resilience.
  • Markets are especially sensitive right now because official BLS data has been disrupted; traders are leaning on ADP and other indicators for clues about employment and inflation.

Why this matters right now

  • The labor market is the primary lever for the Fed: brisk hiring and rising wages give the Fed room to keep rates high; cooling labor reduces near-term inflation pressure and increases the odds of rate cuts or a slower path higher.
  • ADP is not the BLS. It’s a private-sample indicator that often points the way but can diverge from the official jobs number. With some government data delayed in recent weeks, ADP’s read carries outsized influence.
  • Even modest “slack” in hiring can hurt high-valuation sectors (think tech) and tilt flows toward defensive parts of the market.

Market context and background

  • Through 2025 the U.S. labor market has been on a gradual softening trend: monthly hiring has slowed from the heady gains of prior years, and several reports have shown layoffs rising in certain sectors (notably tech and professional services).
  • ADP’s October report (released November 5, 2025) showed a limited rebound with gains concentrated in education, healthcare and trade/transportation — while professional services, information and leisure/hospitality continued to lose jobs.
  • Investors are also watching broader signals: corporate earnings, layoffs data from firms, and other real‑time indicators that can confirm whether hiring weakness is broad-based.

Market movers (how the indexes reacted)

  • S&P 500: slipped as traders priced in slower growth and a slightly stronger chance of policy easing later rather than sooner.
  • Nasdaq: sensitive to growth and earnings momentum, it underperformed at times as soft hiring raises questions about tech demand and valuations.
  • Dow: tended to be steadier, benefiting from more defensive and cyclical names that are less dependent on expansionary sentiment.

A few takeaways for investors and traders

  • ADP matters now because other official data streams are constrained. Treat it as a directional signal, not gospel.
  • A modest slowdown in private payrolls is not the same as a recession signal — but it does change the probabilities on Fed timing and equity valuations.
  • Sector rotation is alive: less tolerance for richly priced growth names, more interest in value, dividends and beaten-down cyclical names if data deteriorates further.

My take

This is classic “data-driven caution.” The October ADP print is neither a dramatic shock nor a reassurance that everything’s fine. It sits in the middle: enough to make markets re-price risk modestly and to keep central-bank watchers glued to the next data points. In that environment, patience matters. Traders will jump on any fresh signal — another payroll read, CPI or corporate guidance — so expect continued intraday swings and heightened sensitivity to headlines.

Final thoughts

Markets are living through a transition: from a hot labor market that justified higher valuations to a more uncertain one where the Fed’s next move is less obvious. That middle ground often brings volatility and opportunity. For long-term investors, the best move is rarely to panic but to reassess portfolio tilt and ensure allocations reflect both risk tolerance and the new economic backdrop.

Sources


Related update: We recently published an article that expands on this topic: read the latest post.


Related update: We recently published an article that expands on this topic: read the latest post.

AI Winners Mask Weak Market Breadth | Analysis by Brian Moineau

November’s market mood: bright leaders, shaky foundation

Monday’s market tape told a familiar — and a little unsettling — story: the Nasdaq and S&P 500 quietly closed higher, lifted by a handful of AI and mega‑cap tech winners, while more than 300 S&P 500 stocks finished the day in the red. That kind of skew — a few names powering headline gains while many constituents lag — is the market’s current frisson: impressive on the surface, fragile underneath.

What happened (the quick read)

  • Major AI‑exposed names and cloud/semiconductor plays rallied and helped the indices eke out gains.
  • Stock futures slipped slightly the next session as investors digested valuation chatter, profit‑taking and mixed earnings signals.
  • Market breadth remained weak: hundreds of S&P 500 components fell even though the cap‑weighted indexes rose, highlighting concentrated leadership.

Why breadth matters

When a market rally is driven by a narrow group of stocks, the headline numbers can mask risk. A cap‑weighted index like the S&P 500 gives outsized influence to the largest companies, so the top handful of megacaps (the “Magnificent Seven” or similar groups) can lift the index even while most companies decline.

  • Narrow leadership raises volatility risk: if one or two leaders stumble, index performance can unwind quickly.
  • Weak breadth signals potential for rotation: sectors or mid‑caps that haven’t participated may suddenly correct further or rebound sharply if sentiment shifts.
  • Valuation sensitivity grows: when gains concentrate in richly valued AI/tech names, any hint of earnings disappointment, regulatory pressure, or slowing adoption can trigger swift re‑pricing.

The context you should keep in mind

  • AI enthusiasm has been a strong theme through 2025: big cloud deals, hyperscaler capex and continued demand for AI chips kept investor attention fixed on a small group of winners.
  • Many companies are still reporting solid earnings — a reason some strategists argue the rally isn’t just speculative. But even with good results, the market’s recovery is uneven.
  • Macro and policy noise (interest‑rate speculation, data delays from the U.S. government shutdown earlier in November, and geopolitical headlines) adds an extra layer of sensitivity to any cracks in leadership performance.

Market signals to watch this week

  • Earnings from big tech, chipmakers and cloud providers — these can either reinforce the narrow rally or expose cracks.
  • Breadth indicators: the number of advancing vs. declining S&P 500 stocks, and how many are above their 200‑day moving averages.
  • Volatility and flows: VIX moves and ETF flows into/out of mega‑cap tech versus broad market funds can show whether investors are rotating or doubling down.
  • Macro prints (jobs, Fed commentary) — still decisive for risk appetite and valuation multiples.

What investors can consider (practical framing)

  • Check exposure concentration: make sure your portfolio isn’t unknowingly overloaded with a few mega‑cap tech names.
  • Think in scenarios, not certainties: prepare for both continued AI momentum and for a re‑rating if sentiment shifts.
  • Revisit risk controls: position sizes and stop rules matter more when leadership is narrow and velocity of moves is high.
  • Look for quality breadth opportunities: beaten‑down cyclicals or small‑caps with improving fundamentals may offer better risk/reward if rotation arrives.

A snapshot: the narrative versus the reality

Narrative: “AI is lifting markets — buy the leaders.”
Reality: AI‑related leadership is real and powerful — but it hasn’t broadly lifted the market. That divergence means headline gains can be fragile if those leaders catch a cold.

My take

I find this market simultaneously thrilling and unnerving. The technology and AI stories driving gains are compelling — real revenue, real capex, and real productivity use cases — but markets priced on a handful of outcomes are brittle. For investors, nuance matters more than conviction right now: it’s a time to be thoughtful about concentration, to respect strong themes like AI without letting them blind you to poor breadth, and to balance optimism with risk management.

Sources


Related update: We recently published an article that expands on this topic: read the latest post.


Related update: We recently published an article that expands on this topic: read the latest post.