TL;DR
-
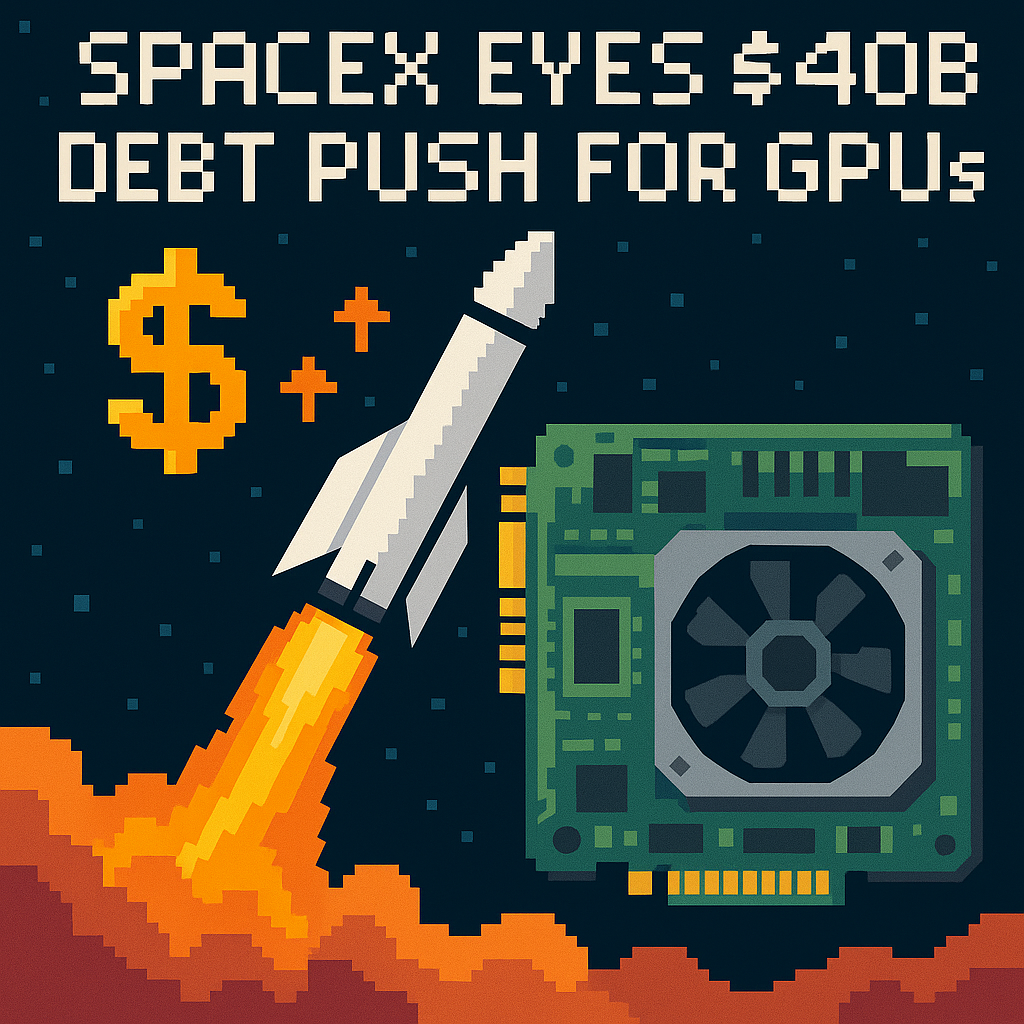
SpaceX is reportedly lining up $40 billion of new debt to buy Nvidia chips, split into roughly $30 billion of bonds and $10 billion of bank loans; Apollo Global Management is said to be leading the process, with PIMCO evaluating allocations. That magnitude would reshape SpaceX’s capital structure and the AI-capex race in 2026. [1][2]
-
Management is pointing to a fast-growing Memphis/Southaven “Colossus” data-center business—backed by compute leases reportedly totaling $41.1 billion annually and a fresh $1.11 billion per month hosting deal starting December 1, 2026—to argue cash flow can service the leverage. [1][3][4]
-
If SpaceX deploys $40 billion into Nvidia systems at 2025 pricing, it could be buying about 1.0–1.1 million GPUs—enough to operate as a top-tier compute lessor—assuming it secures ≥1.0 GW of power, sustains high utilization, and avoids being boxed into 6–7% coupons for a decade. [4][5][6]
What the source said
Yahoo Finance reported SpaceX shares fell about 2.5% after news that the company is seeking $40 billion in debt financing to purchase Nvidia chips for data centers, with a split of $10 billion in bank loans and $30 billion in investment‑grade bonds. Apollo Global is reportedly leading the financing and PIMCO is reviewing the deal. The article cites CFO Bret Johnsen telling investors SpaceX is on track to $100 billion in ARR, aided by AI compute contracts, including a $1.11 billion‑per‑month hosting agreement that starts December 1, 2026; analysts framed the debt as fuel for SpaceX’s AI buildout in Memphis’s Colossus 1–2. [1]
Why it matters
For bond markets, SpaceX would test appetite for one of the largest single corporate AI‑infrastructure financings to date, as U.S. investment‑grade yields hover around the mid‑5% to mid‑6% area depending on duration and rating. That locks in a tangible cash cost of capital for accelerators that depreciate on product cycles measured in quarters, not decades. [2][5][6]
For SpaceX equity holders, the pivot introduces a third economic engine alongside launch and Starlink: AI compute capacity at industrial scale in Tennessee and Mississippi. The bull case says contracted backlog and Starlink cash generation absorb interest; the bear case flags Memphis‑area power constraints, counterparty termination clauses, and covenants that could crimp flexibility just as GPU architectures turn over faster. [1][3][4]
Original analysis
SpaceX $40 billion debt for Nvidia chips: what the numbers imply
-
Back‑of‑envelope: interest burden
- Assume $30B of bonds priced near the Moody’s Baa composite yield of ~6.3%–6.5% and $10B of bank loans at ~7.0% all‑in (illustrative). Annual interest ≈ ($30B × 6.4%) + ($10B × 7.0%) ≈ $1.92B + $0.70B ≈ $2.62B per year. Even with a tighter bond print at 6.0%, total interest likely lands around $2.3–$2.7B. [6][5]
- Compare to AI‑compute ARR: CFO remarks include $1.11B/month (~$13.3B/year) starting December 2026, layered atop earlier deals; DataCenterDynamics pegs total compute leases at $41.1B annually post‑award. Gross coverage looks ample; net coverage depends on power, networking, cooling, and depreciation. [3][1]
-
Back‑of‑envelope: how much hardware is $40B?
- A typical 8×H100 system listed in 2024–2025 reports at ~$280k–$300k implies ~$35k–$37.5k per GPU equivalent; Reuters has cited H100 pricing from ~$16k to ~$100k depending on config and volume. Using $37.5k/GPU as a conservative blended figure, $40B buys ≈ $40,000,000,000 / $37,500 ≈ ~1.07 million GPUs. [6][7]
- Fortune reported SpaceX’s Colossus plan contemplates ~1 million GPUs, aligning with the capex math; the capital would fill Colossus 1–2 and seed a next wave if power and cooling arrive on time in Shelby and DeSoto Counties. [4]
-
2×2 framework: where this can go right—or wrong
- Axis 1: Demand visibility (contracted vs. speculative). Axis 2: Financing structure (on‑balance‑sheet vs. ring‑fenced/SPV).
- Contracted + SPV: “Utility model.” If Apollo syndicates asset‑backed structures against take‑or‑pay compute, bonds price safer and cheaper; SpaceX preserves parent flexibility. [2]
- Contracted + On‑balance: “Heavy core.” Execution is simpler, but consolidated leverage and refinancing risk rise at the corporate level.
- Speculative + SPV: “Option with recourse‑lite.” Works only if GPUs retain resale value and there’s a deep secondary market.
- Speculative + On‑balance: “Overhang.” Worst quadrant: elevated net leverage, front‑loaded capex, and utilization risk in fast chip cycles.
- Axis 1: Demand visibility (contracted vs. speculative). Axis 2: Financing structure (on‑balance‑sheet vs. ring‑fenced/SPV).
-
Named‑stakeholder breakdown
- Apollo Global Management: Wins by templating AI‑infra ABS—chips, racks, and contracted workloads packaged for pensions and insurers—earning fees and a marquee mandate. [2]
- PIMCO and other IG buyers: They want duration with coverage. If compute ARR is durable and cancellability is limited, they’ll consider BBB‑area paper at mid‑100s bps over Treasuries; Bloomberg Línea noted SpaceX credit spreads widening as risk repriced in 2026. [2][8]
- Nvidia: A 1‑million‑GPU order anchors Blackwell‑generation volumes and tightens ecosystem lock‑in across CUDA and NVLink in 2026–2027. [7]
- Anthropic/Google and other tenants: Near‑term compute certainty, potentially at premium pricing; mid‑term risk if contracts carry 90‑day outs and market prices normalize by late 2027. [4]
- TVA/MLGW (power): Memphis‑area power interconnection and on‑site generation are gating factors; delays or rate disputes would hit revenue timing more than 50–100 bps of bond spread would. [4][10]
-
Contrarian read
- Consensus: “$40B of debt is aggressive, but contracted AI ARR makes the math work.”
- Counter: The bond math only holds if compute scarcity persists and tenants stay locked. Fortune flagged 90‑day cancellation mechanics on marquee contracts; if hyperscalers overbuild by 2027, SpaceX could become a price taker facing ~$2.5B+ in annual interest with rapidly depreciating accelerators. In that world, ring‑fencing and take‑or‑pay terms become existential, not optional. [4][5][6]
What others are missing
Coverage dwells on “can SpaceX borrow $40B?” instead of “what secures the $40B?” In project finance, lenders underwrite hard collateral, firm offtake, and predictable fuel costs; here, the “fuel” is TVA/MLGW‑delivered electricity plus on‑site generation, the “offtake” is AI workloads with short‑term opt‑outs, and the “plant” is GPUs that lose value every product cycle. The likely fit is not plain‑vanilla IG corporates alone, but asset‑backed tranches tied to specific Memphis/Southaven halls with covenants on power availability, utilization, and contract duration. That structuring choice will set pricing, tenor, and whether this becomes a repeatable template or a one‑off. [2][4][10]
What to watch next
-
By January 31, 2027, SpaceX closes at least $20B of the $40B financing, with at least one tranche ring‑fenced to an SPV secured by GPUs/racks and assigned AI contracts; evidence should appear in offering documents or Apollo syndication materials. [2]
-
By Q2 2027, Colossus reaches ≥1.3 GW nameplate IT power in Memphis/Southaven, reflected in TVA/MLGW interconnection or load‑add filings and corroborated by data‑center trade reporting; any shortfall implies slippage in capex‑to‑revenue conversion. [4][10]
-
By Q4 2027, SpaceX discloses annualized AI compute revenue ≥$50B or reports material contract attrition; either datapoint will validate or undercut the debt‑service coverage thesis presented in 2026. [3][4]
My take
If SpaceX truly sees line‑of‑sight to ≥$40B in annualized compute revenue, sprinting with long‑dated capital in 2026 makes sense. The smart path is to finance like energy infrastructure: carve assets into SPVs, secure take‑or‑pay with real penalties, and hardwire power performance with TVA/MLGW covenants. Done that way, a 6–7% coupon looks acceptable for tenors stretching into the 2030s; done sloppily, the company buys an interest bill and a depreciation clock that could tick faster than Starship’s flight cadence. Structure—not hype—decides the outcome. [2][3][5][6]
Sources
-
SpaceX stock slips on report of its $40 billion in new debt for Nvidia chips — Yahoo Finance (https://finance.yahoo.com/markets/stocks/article/spacex-stock-slips-on-report-of-its-40-billion-in-new-debt-for-nvidia-chips-140223011.html) — News of the $40B plan, $30B bonds/$10B loans split, Apollo/PIMCO mentions, and CFO Bret Johnsen’s $1.11B/month deal and $100B ARR remarks.
-
SpaceX is going on a bond binge — Axios (https://www.axios.com/2026/10/07/spacex-bond-binge-nvidia-apollo) — Corroborates the $40B chip‑buy financing, Apollo’s lead role, and the proposed structure.
-
SpaceX signs compute contract valued at $13.3bn annually — DataCenterDynamics (https://www.datacenterdynamics.com/en/news/spacex-signs-compute-contract-valued-at-133bn-annually/) — Details the $1.11B/month contract starting Dec 1, 2026, and cites leases totaling $41.1B annually.
-
SpaceX is quietly building an AI compute business that may become key to its eye‑popping valuation — Fortune (https://www.fortune.com/2026/07/19/spacex-ai-compute-renting-business-google-anthropic-pentagon-deals-revenue-valuation-elon-musk-colossus-data-centers/) — Covers Colossus 1–2 in Memphis/Southaven, ~1 GW+ plan, tenant names, and termination mechanics.
-
Moody’s Seasoned Aaa Corporate Bond Yield (AAA) — FRED, St. Louis Fed (https://fred.stlouisfed.org/series/AAA) — Investment‑grade yield context (e.g., ~5.9% in mid‑2026) to frame coupon ranges.
-
Moody’s Seasoned Baa Corporate Bond Yield (WBAA) — FRED, St. Louis Fed (https://fred.stlouisfed.org/series/WBAA) — BBB‑area borrowing costs (~6.3% in early Sep 2026) used in interest estimates.
-
Exclusive: Nvidia pursues $30B custom chip opportunity with new unit — Reuters via Investing.com (https://www.investing.com/news/economy/exclusivenvidia-chases-30-billion-custom-chip-market-with-new-unit-sources-3299055) — Cites H100 price ranges that bound per‑GPU capex math.
-
SpaceX dispara su riesgo crediticio tras buscar US$40.000 millones para chips de Nvidia — Bloomberg Línea (https://www.bloomberglinea.com/mercados/spacex-dispara-su-riesgo-crediticio-tras-buscar-us40000-millones-para-chips-de-nvidia/) — Credit‑market color: CDS/spread moves and investor positioning around the Apollo‑led construct.
-
Electric Power Monthly — U.S. Energy Information Administration (https://www.eia.gov/electricity/monthly/) — State/regional capacity and industrial load trends informing TVA/MLGW power availability.
-
Connecting to TVA’s Transmission System — Tennessee Valley Authority (https://www.tva.com/energy/transmission/connecting-to-tva-s-transmission-system) — Interconnection process and constraints relevant to large data‑center loads in the Memphis area.
Related update: We recently published an article that expands on this topic: read the latest post.
Related update: We recently published an article that expands on this topic: read the latest post.