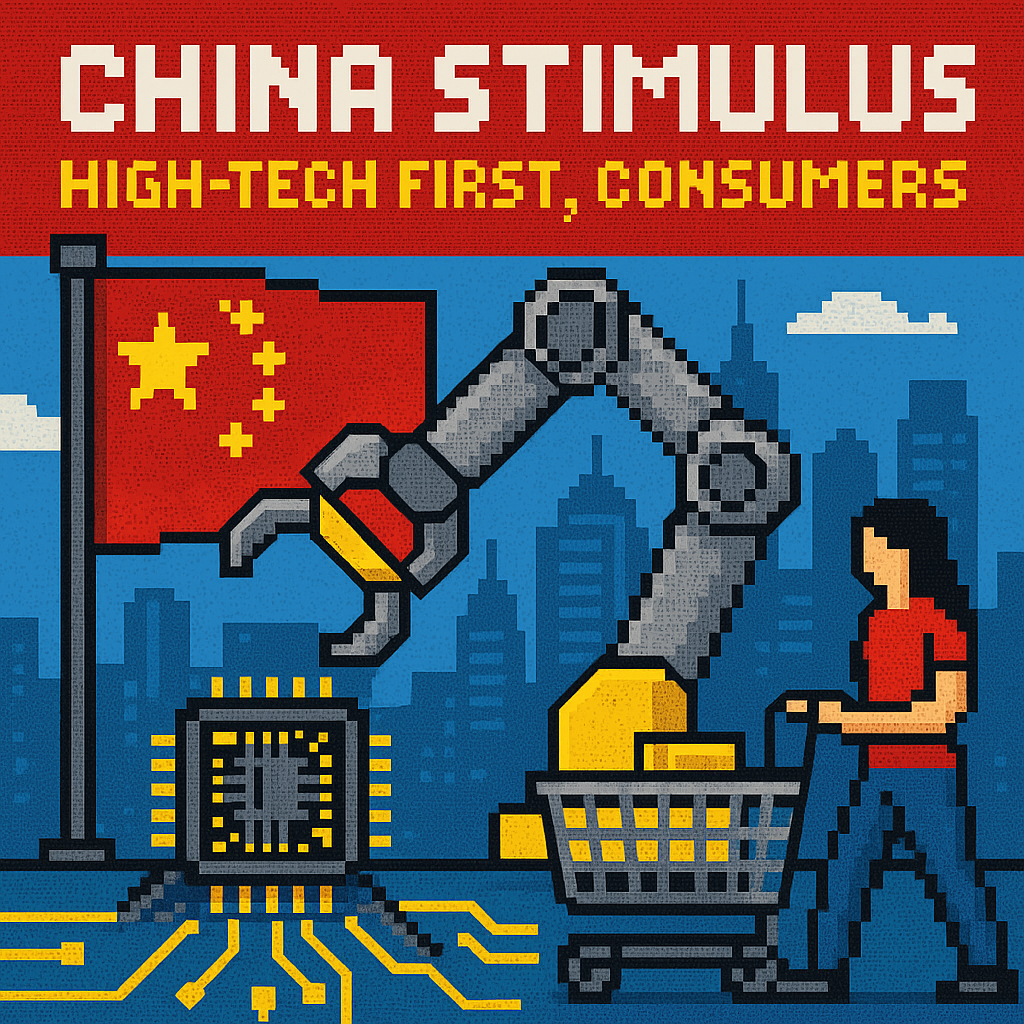
China stimulus: High-tech first, consumers | Analysis by Brian Moineau

TL;DR

  • Beijing is signaling more “China stimulus,” but the playbook still points to targeted support for high‑tech capacity and balance‑sheet repair—not a big-bang cash splash for households, as flagged by the Financial Times ahead of the late‑July 2026 Politburo readout [1].
  • With Q2 2026 growth down to 4.3% and June retail sales up just 1.0% y/y, tech‑led support risks propping up factories while domestic demand stays weak, deepening imbalances that invite more foreign tariffs from the US, EU, and Mexico [2][6].
  • The key number isn’t the headline pledge—it’s the composition: an 8.1% of GDP 2026 consolidated deficit with only a 0.3% fiscal impulse suggests precision-guided spending; unless more goes to households and property completion, growth hovers near 4.5% and confidence lags [4][5].

What the source said

The Financial Times reports that Chinese leaders in Beijing are preparing stimulus for H2 2026 but are prioritizing “spurring high-tech” over a sweeping consumption package, with signals expected after a late‑July 2026 Politburo meeting [1]. Analysts anticipate measures that channel capital into advanced manufacturing, AI infrastructure, and green tech rather than a 2008‑style broad transfer to households [1]. The backdrop features property stress, weak private investment, soft consumer sentiment, and rising trade frictions with the US and EU in 2026 [1][6]. Markets are therefore watching for targeted—not across‑the‑board—stimulus signals that point to execution via industrial policy rather than vouchers [1].

Why it matters

Three groups have the most at stake in 2026. First, Chinese households: wage growth has cooled, property wealth has eroded, and retail sales rose just 1.0% y/y in June 2026—so a tech‑first package risks bypassing them and prolonging caution on big‑ticket spending [2]. Second, manufacturers in EVs, batteries, and AI hardware: targeted credit and fiscal support can keep capacity humming, but it also courts foreign backlash via duties and probes already discussed in the US, EU, and Mexico this year [6]. Third, local governments: they carry implementation and financing burdens while land‑sale revenues fall, which constrains the pace and breadth of any rollout in 2026 [5].

Original analysis

Consensus view in mid‑2026: China will add stimulus, but it will be selective—aimed at high tech and industrial upgrading—rather than a “big bang” for household consumption [1][6]. I agree on direction but think markets underprice how that mix caps near‑term growth and amplifies external blowback if domestic demand stays weak.

  • Hard data first. Q2 2026 GDP slowed to 4.3% y/y, a 3‑1/2‑year low. June retail sales rose 1.0% while industrial output climbed 5.3%, a picture of strong factories and weak shoppers [2]. The PBoC’s Q2 statement promises “accommodative” conditions but confirms no policy rate or RRR cuts since May 2025, alongside an official growth band near 4.5%–5.0% for 2026—stability over urgency [3].

  • Fiscal reality check. The World Bank estimates China’s 2026 consolidated deficit at 8.1% of GDP, up from 7.2% in 2025, yet the fiscal impulse is only 0.3% of GDP because soft revenues and off‑budget constraints dilute the boost [5]. Translation: big headline deficit, modest net demand support.

  • Property is the fulcrum. Real home prices are down 23% from the July 2021 peak, and a “white‑list” has steered over RMB 7 trillion to viable projects, yet completion remains the choke point; the World Bank pegs inventory clearance at roughly 30 months at current sales rates [5]. Developer financing continued to contract year over year in May 2026, and bank lending to developers has trended lower since 2023, keeping household precautionary saving elevated [5].

  • External friction is the kicker. A tech‑first boost tilts supply toward EVs, solar, batteries, and AI hardware—sectors already under investigation or tariff pressure in Brussels, Washington, and Mexico City in 2026 [6]. Pushing capacity into a world adding barriers means the marginal unit may face a blocked market [6].

Back‑of‑envelope math: how big is “more stimulus,” really?

  • China’s 2025 nominal GDP: RMB 140.19 trillion (NBS) [7].
  • World Bank estimate of 2026 fiscal impulse: 0.3% of GDP [5].
  • 0.3% × RMB 140.19t ≈ RMB 420.6b of net demand support.

Now compare: the property white‑list loan stock is “over RMB 7 trillion”—about 5.0% of 2025 GDP—but it’s allocation for completion, not pure demand stimulus [5][7]. Even with better execution, the near‑term multiplier is smaller than direct household transfers or broad VAT cuts, which is why a 4.5%–5.0% growth outcome is feasible but biased to the low end if consumption drags [4][5].

2×2: China stimulus choices (what Beijing is likely optimizing)

  • Short‑term × Broad: Household vouchers, VAT cuts, payroll tax holidays. Fast retail boost; higher import leakage and local fiscal strain.
  • Short‑term × Targeted: “White‑list” completions, SOE purchases of unsold inventory for affordable housing, AI‑compute subsidies. Quick but narrow; fixes bottlenecks without lifting mass demand [5].
  • Long‑term × Broad: National social insurance upgrades, hukou reform, transfer programs. Durable consumption share gains; requires structural fiscal changes and political will [4].
  • Long‑term × Targeted: Industrial policy for semis, EVs, batteries, and grids. Raises potential output; risks overcapacity and retaliation if demand rebalancing lags [6].

Beijing is operating in the lower‑right and upper‑left boxes—targeted now, reform later. That mix preserves control in 2026 and limits moral hazard, but it delays the confidence effect that gets households to spend [4][5].

Named‑stakeholder breakdown

  • BYD and CATL: Probable winners from credit‑steered capex into EVs and storage; watch for more grid‑side projects and export headwinds if the EU or Mexico tighten duties in late 2026 [6].
  • Huawei and SMIC: Likely beneficiaries of AI‑compute and “self‑reliance” budgets; domestic orders rise, but export channels face controls and scrutiny in 2026 [6].
  • State Grid Corporation of China and data‑center operators: More capex for transmission and AI infrastructure aligns with “precision” stimulus and green goals flagged by multilaterals [5].
  • Local governments and LGFVs: Higher implementation burden with thinner land‑sale cash; project approval reforms and fiscal limits curb scattershot building in 2026 [5].
  • Households: Marginal beneficiaries unless completions accelerate and social spending outpaces GDP; otherwise retail stays soft and precautionary saving persists through H2 2026 [2][5].

What others are missing

Commentary focuses on “how big” the package is, not “how it flows” through China’s clogged transmission channels in 2026. Two plumbing details matter more than the headline: escrow ring‑fencing and completion finance. The World Bank traces delays to weak collateral, shrinking bank appetite, and heavy reliance on presales; despite RMB 7+ trillion in white‑list loans, developer financing remains tight and clearing inventory is a 30‑month job at current sales rates [5]. If policymakers hard‑wire escrow oversight and guarantee last‑mile funding, they deliver the biggest confidence dividend available in 2026—buyers believe keys are imminent, private developers regain cash flow, and consumer durables spending follows [5].

What to watch next

  1. By October 31, 2026, the PBoC trims the 1‑year MLF rate by at least 10 bps as Q3 data confirm sub‑5% growth and persistent retail weakness, aligning with official “accommodative” guidance [2][3][6].
  2. By December 31, 2026, cumulative “white‑list” lending tops RMB 8 trillion, and the NBS reports a year‑end backlog‑clearing time under 27 months, down from 30 months in March 2026 [5].
  3. By Q4 2026, China’s CPI averages 1.0%–1.5% y/y, signaling demand shortfall despite solid industrial output, in line with IMF and World Bank projections for a soft consumption recovery [4][5].

My take

A disciplined, tech‑forward package can move the needle in 2026—but only if it turns presold shells into keys and lifts social outlays from rounding error to anchor [4][5]. If Beijing keeps stimulus precision‑guided and delays household support, growth hugs 4.5%, foreign pushback intensifies, and imbalances widen into 2027 [4][6]. Pair AI kits with apartment keys and a faster safety net, and 2026 lands near 5.0% with a cleaner 2027 glide path; my base case is a Q4 tilt toward households, small in yuan but large in signal [4][5].

Sources

  1. Chinese leaders zero in on need for stimulus for economy — Financial Times (https://www.ft.com/content/9cf9b393-3ac7-4cfc-9dd1-4fc23831e6a0?syn-25a6b1a6%5Cu003d1) — Reports Beijing’s stimulus focus on high tech over a broad consumption package and flags the late‑July 2026 Politburo readout.

  2. China’s Q2 economic growth cools to 3‑1/2‑year low as imbalances worsen — Reuters via Investing.com (https://www.investing.com/news/economy-news/chinas-q2-gdp-growth-slows-to-43-yy-misses-market-forecast-4792122) — Provides the 4.3% Q2 GDP figure, weak June retail sales, stronger industrial output, and the political timetable.

  3. China’s central bank pledges to maintain accommodative policy amid weak demand, external shocks — Reuters via Investing.com (https://m.investing.com/news/economy-news/chinas-central-bank-pledges-to-maintain-accommodativepolicy-amid-weak-demand-external-shocks-4781334?ampMode=1) — Summarizes the PBoC’s Q2 policy stance, absence of rate/RRR cuts since May 2025, and the 2026 growth band.

  4. How China’s Economy Can Pivot to Consumption‑led Growth — IMF (https://www.imf.org/en/news/articles/2026/02/18/cf-how-chinas-economy-can-pivot-to-consumption-led-growth) — Shares a 2026 growth projection near 4.5% and concrete rebalancing steps to lift consumption.

  5. China Economic Update — July 2026 — World Bank (https://thedocs.worldbank.org/en/doc/0cb2fc6dd88d4db3816dc0433b5cb49b-0070012026/original/CEU-July-2026-EN.pdf) — Details the 8.1% consolidated deficit plan, a 0.3% fiscal impulse, property metrics (−23% from 2021 peak, RMB 7t white‑list), and the ~30‑month clearance estimate.

  6. 5 takeaways from China’s Central Economic Work Conference as Beijing maps its 2026 growth path — Channel NewsAsia (https://www.channelnewsasia.com/east-asia/china-central-economic-work-conference-5-takeaways-2026-priorities-5578916) — Explains emphasis on fine‑tuning, innovation/green pillars, and the external barrier backdrop in 2026.

  7. Statistical Communiqué of the People’s Republic of China on the 2025 National Economic and Social Development — National Bureau of Statistics (https://www.stats.gov.cn/english/PressRelease/202602/t20260228_1962661.html) — Confirms 2025 nominal GDP at RMB 140.19 trillion used in the calculation.


Related update: We recently published an article that expands on this topic: read the latest post.
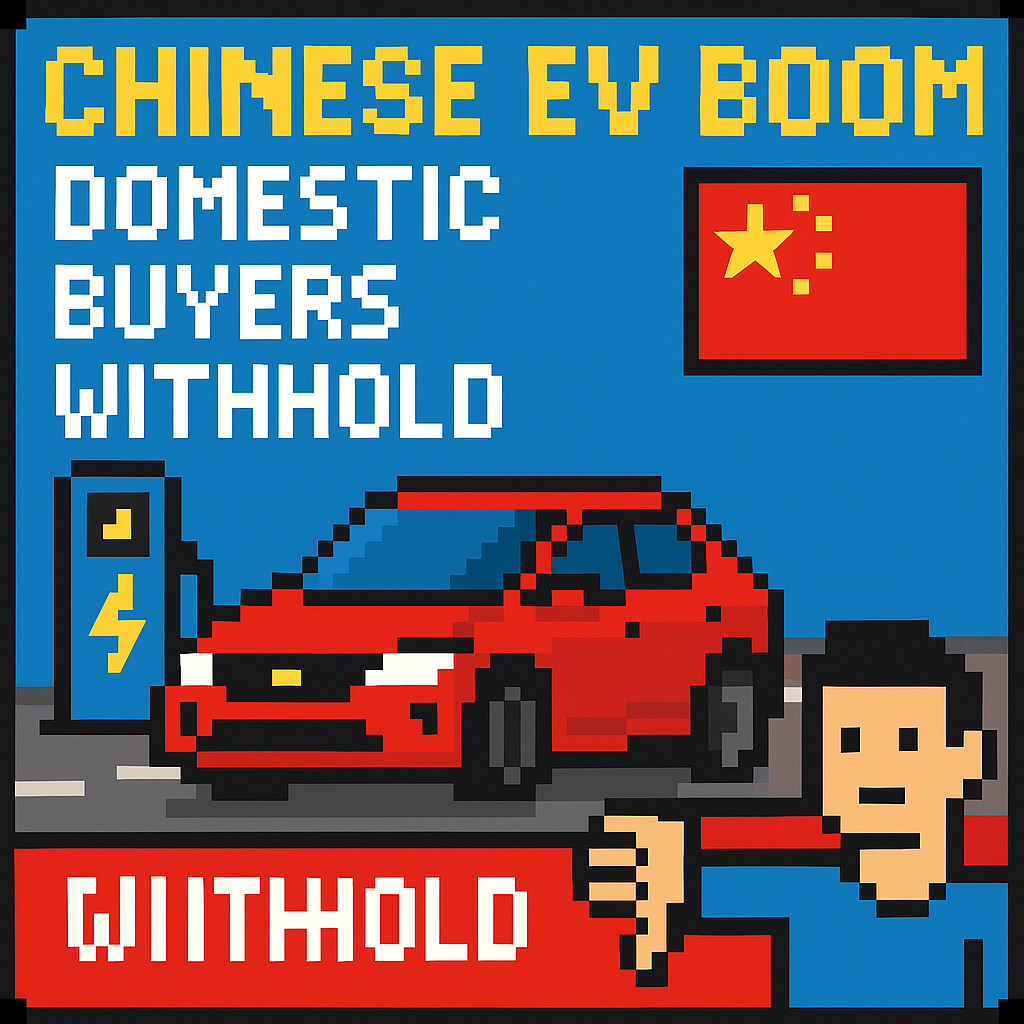

Chinese EV Boom, Domestic Buyers Withhold | Analysis by Brian Moineau

TL;DR

  • Chinese automakers are climbing global sales rankings, yet China’s own buyers delayed purchases through early 2026 amid a bruising price war and falling resale values, flipping the old “home‑market first” playbook [1][2][4][5].
  • Exports cushion P&Ls for now, but European Commission duties of 17.4%–37.6% on China‑made BEVs force double‑digit retail hikes or margin absorption in the EU’s 27 member states [3].
  • Over the next 12 months (mid‑2026 to mid‑2027), low‑cost exporters like BYD and Chery can ride volume abroad, while domestically exposed players face a grind of margin pressure, inventory risk, and model fatigue inside China [2][4][6].

What the source said

The Wall Street Journal’s “Everyone Loves Chinese Cars, Except the Chinese” (via Google News RSS) argues that Chinese automakers are winning abroad while domestic demand sags, a paradox visible in 2025–2026 sales patterns [1]. The piece ties booming exports to price competitiveness and fast model cycles, noting that those same dynamics—relentless refreshes and discounting—have trained home buyers to wait. It sets Europe and several emerging markets as bright spots, contrasted with a promotion‑heavy Chinese retail market weighed down by weak residuals and buyer hesitation; exports exceeded 7 million vehicles in 2025, while the home market cooled [2]. It also sits against a policy backdrop: January 2026 passenger‑car sales fell 19.5% year on year, and Brussels added BEV duties of up to 37.6% [3][4].

Why it matters

  • Stakeholder #1: Chinese automakers (BYD, SAIC, Chery, Geely). They gain share overseas as exports surpassed 7 million in 2025 (+21% year over year), but they face a soft home market and tightening rules against aggressive discounting in 2026 [2][4][5]. Every incremental export lifts factory utilization, yet domestic pressure tests cash flow, dealer solvency, and software update cadence.

  • Stakeholder #2: Policymakers in Brussels and Beijing. The European Commission imposed provisional countervailing duties on China‑made BEVs—BYD 17.4%, Geely 19.9%, SAIC 37.6%—re‑pricing value segments from Portugal to Poland and forcing localization decisions in 2026–2027 [3]. Beijing moved to curb the price war after January 2026’s 19.5% sales drop, signaling tolerance for discipline over chaotic promotions [4].

Original analysis

Consensus says, “Exports will save China’s carmakers while home demand chills.” Contrarian read: exports are a pressure valve, not a moat. EU duties and politics can turn a 10% cost edge into a wash, while China—still the world’s largest auto market by units—decides who survives by 2027 [2][3][4].

Back‑of‑envelope math:

  • Scale today: China exported “over 7 million” vehicles in 2025; domestic passenger‑car sales were about 24 million [2]. Exports ≈ 7 ÷ (24 + 7) ≈ 23% of unit volume. If 2026 exports grow only low single digits per CPCA commentary and domestic sales stagnate, export share inches toward ~24%—helpful, but not enough to offset multi‑point margin hits from tariffs and incentives [5].
  • Tariff impact in the EU: Assume a €15,000 ex‑factory BYD BEV. A 17.4% duty lifts border cost by €2,610; if pre‑tariff retail was €25,000, holding margin implies roughly a 10% retail hike or painful absorption by the OEM/importer. For SAIC at 37.6%, the duty is €5,640—nearly a full gross margin on an entry BEV, before distribution and financing [3].

Named‑stakeholder breakdown:

  • BYD: Cost leader with DM‑i hybrids and BEVs. A 17.4% EU duty narrows the price gap but doesn’t erase it; expect CKD/SKD or final assembly pilots inside the EU Customs Union to blunt tariffs, while hybrids keep flowing into duty‑light markets [2][3].
  • SAIC (MG): Heavy EU/UK exposure makes the 37.6% duty acute; localization or price/mix shifts can’t wait. Watch pushes into Brazil, Mexico, and the Middle East, where regulatory barriers and duties are lower in 2026 [3].
  • Chery: China’s top vehicle exporter in 2024; strong in emerging markets with ICE and PHEV lines. Less EU‑centric near‑term, but brand equity must rise to avoid “race‑to‑bottom” traps as volumes expand [6].
  • Volkswagen (China JVs): China’s slowdown squeezes legacy ICE cash cows while an EV revamp rolls out; if share erosion persists through 2026, VW’s China profit pool shrinks as Euro 7 and CO2 rules bite in Europe [5].
  • Policymakers (EU/China): Brussels raises drawbridges with countervailing duties; Beijing polices the price war after a steep January 2026 fall. Policy swings compress planning horizons and elevate inventory risk for 2026 model years [3][4].

2x2 typology (Cost position × Domestic dependency):

  • Low cost × Low domestic dependency: Chery (export‑heavy, flexible on ICE/PHEV) and SAIC‑MG if it localizes in the EU quickly.
  • Low cost × High domestic dependency: BYD (still sells the bulk in China; exports rising from a small 2023–2024 base).
  • High cost × Low domestic dependency: Geely’s premium trims in select export markets; needs localization/alliances to hold price after duties.
  • High cost × High domestic dependency: NIO and XPeng (software‑heavy, brand‑building phase), most exposed to residual‑value shocks in 2026.

Historical analogue:

  • Late‑1970s to mid‑1980s Japan hit U.S./EU barriers and pivoted to localization (e.g., NUMMI and Kentucky assembly). China’s champions will copy that template faster because they control batteries, inverters, and E/E stacks end‑to‑end; expect “build‑where‑you‑sell” by 2027 in tariff‑exposed regions.

What others are missing

The resale‑value loop is dictating Chinese consumer behavior more than ad spend. Rapid fire refreshes and publicized cuts trained buyers to wait, crushing used‑car prices and blowing up monthly‑payment math. That shows up as NEV penetration topping 40% in early 2026 without delivering steady throughput for every brand, a mismatch CPCA data flagged alongside soft retail prints into May 2026 [5]. When January 2026 sales fell 19.5% and regulators cracked down on pricing games, Beijing aimed to rebuild residual‑value credibility so buyers would stop freezing purchases [4]. If OEMs stabilize depreciation—with certified pre‑owned floors, longer battery warranties, and 90‑day price‑protection guarantees—domestic demand can rebound faster than export growth alone.

What to watch next

  1. By Q4 2026, at least one top‑five Chinese exporter announces EU final assembly or CKD capacity sized for 100,000+ units per year to blunt provisional duties; announcement specifies plant location inside the EU Customs Union [3].
  2. By Q1 2027, China’s passenger‑car retail posts year‑on‑year growth for two straight quarters as price‑war rules and stabilized residuals take hold; CPCA reports positive comps in at least two of three months each quarter [4][5].
  3. By mid‑2027, at least one major European incumbent discloses a China JV EBIT margin below 2% in an annual or interim filing, citing local EV competition and discounting pressure in 2026–2027 [5].

My take

Exports bought time, not safety. The profit engine still lives—or dies—inside China. If brands can’t steady depreciation and end the discount addiction, they’ll bleed capital while Brussels taxes away foreign margin. Expect a shake‑out down to a half‑dozen scale players that localize in tariffed markets and enforce price discipline at home; BYD and Chery make the cut, while SAIC must localize or rethink its EU stance.

Sources

  1. Everyone Loves Chinese Cars, Except the Chinese — The Wall Street Journal via Google News RSS (https://news.google.com/rss/articles/CBMilAFBVV95cUxNc2hUR0tKTU5zUUFuN3N1VzBXUjRnN3FyZHlQd09MZGhqbjZBbEI3S0JkVEhDUWd1U2R3X3A4Rm10d3JSMVlKRW9BSUhWU1hock1qcDZ0MlZ5Sm5VeFJ5NGhxazdMemhseE5GNlhFeVdnOUkyQUlmQ3dyc0F5OFFsZ2dYMmZaWWdXT281SUJVb2RXQmxx?oc=5) — Frames the paradox of strong exports vs. hesitant Chinese buyers and highlights price‑cut dynamics.
  2. China’s car exports surged in 2025, but domestic demand slowed — AP News (https://apnews.com/article/871137ad17b9e491e14da0e6de1e1cc6) — Confirms 2025 exports “over 7 million” (+21% YoY) and slower home‑market momentum.
  3. Commission imposes provisional countervailing duties on imports of battery electric vehicles from China — European Commission (press release, IP_24_3630) (https://ec.europa.eu/commission/presscorner/api/files/document/print/en/ip_24_3630/IP_24_3630_EN.pdf) — Lists provisional duty rates (BYD 17.4%, Geely 19.9%, SAIC 37.6%) and EU scope.
  4. China issues new rules to curb auto price war after January passenger car sales drop 20% — AP News (https://apnews.com/article/c5c32f6982cc163764e8941e1df3d9a2) — Details the 19.5% YoY drop in January 2026 and Beijing’s response to discounting.
  5. China car sales downturn extends into May as VW tests EV revamp — Reuters via Investing.com (https://www.investing.com/news/economic-indicators/china-car-sales-downturn-extends-into-may-as-vw-tests-ev-revamp-4730983) — Shows domestic softness into May 2026 and summarizes CPCA expectations and VW’s China pivot.
  6. 中汽协公布2024年整车出口TOP10:奇瑞、上汽、长安前三,比亚迪同比增长71.8% — Sina Finance (https://finance.sina.com.cn/tech/digi/2025-01-13/doc-ineevenx2156132.shtml) — Ranks 2024 export leaders (Chery, SAIC, Changan) and quantifies exporter mix.

(Inline citations: [1]–[6].)

BYD Overtakes Tesla as EV Leader | Analysis by Brian Moineau

When the Crown Slips: BYD Tops Tesla in the Global EV Race

A short, sharp image comes to mind: the electric vehicle throne — long assumed to be Elon Musk’s exclusive domain — quietly shifting eastward. In 2025, China’s BYD sold more fully electric cars than Tesla, marking the first time Tesla has been definitively overtaken on annual BEV (battery-electric vehicle) deliveries. That moment deserves a second look: it’s not just a change in ledger lines, it’s a sign of how fast the EV playing field is changing.

What happened

  • Tesla’s full-year deliveries fell in 2025 to roughly the mid-to-high 1.6 million range, down from about 1.79 million in 2024. Reuters and other outlets reported an annual decline driven by softer demand and the end of a key U.S. federal EV tax credit. (reuters.com)
  • BYD’s fully electric (BEV) sales jumped about 28% year-on-year, reaching a figure above 2.2 million BEVs in 2025 — while the company’s total passenger-vehicle deliveries (including plug-in hybrids) were much larger still. That helped BYD claim the top spot for BEV deliveries worldwide. (nasdaq.com)

Why this matters

  • Market leadership signals matter beyond ego: they shape investor narratives, supplier leverage, dealer and service footprints, and the direction of R&D budgets.
  • BYD’s win highlights a structural reality: scale in China + aggressive product mix (including lower-priced models) + rapid export growth = a powerful engine for volume.
  • Tesla’s setback suggests the company faces cyclical and structural headwinds: tougher competition in China and Europe, pricing pressures, and policy shifts (notably U.S. tax credit changes) that can swing consumer demand.

Quick takeaways for busy readers

  • BYD surpassed Tesla on annual BEV deliveries in 2025, driven by strong growth at home and surging exports. (forbes.com)
  • Tesla’s deliveries fell versus 2024; a key factor was the expiration of a U.S. federal tax credit that had boosted EV purchases. (reuters.com)
  • The gap reflects two different strategies: BYD’s high-volume, vertically integrated approach across price segments vs. Tesla’s higher ASP (average selling price) and continued focus on premiuming technology and margins. (statista.com)

The broader context

  • China is both the world’s largest EV market and a global manufacturing powerhouse. Domestic scale allows Chinese OEMs to iterate quickly on cost, battery chemistry, and model range — then export those efficiencies abroad.
  • BYD’s mix includes a significant volume of plug-in hybrids (PHEVs) alongside BEVs; while the global “BEV crown” is the headline, BYD’s overall passenger-vehicle scale (BEVs + PHEVs) gives it production flexibility and revenue diversification. (nasdaq.com)
  • Tesla still holds advantages: brand cachet, software and energy-integration narratives, an established Supercharger network in many markets, and high-margin software/Autopilot services. But those advantages are being contested on price, product breadth, and local partnerships in key markets.

What this could mean going forward

  • Competition will intensify on price and features. Expect more affordable models from legacy and new EV players, plus broader rollouts of mid-market tech (e.g., fast charging at lower cost). (autoini.com)
  • Global market share could fragment. Tesla may focus on differentiation (software, autonomy, energy) while BYD leverages scale and cost to win mainstream buyers and expand exports.
  • Regulation and incentives will remain swing factors. Policy changes (subsidies, tax credits, import rules) can rapidly change demand dynamics across regions.

My take

This shift is important, but not catastrophic for Tesla. It’s a signal that the EV market is maturing: leadership is contestable, and product, price and distribution matter as much as hype. BYD’s ascent is a reminder that manufacturing scale, vertical integration (including battery production) and a broad product ladder can win volume — especially when a domestic market as large as China’s acts as a testing ground and springboard.

For Tesla, the choice is tactical and strategic: defend volume with pricing and localized models where needed, and double down on the unique strengths that keep margins and future optionality intact (software, energy, and autonomy). For BYD, the opportunity is to convert volume into durable share in markets outside China while protecting profitability as it scales globally.

Final thoughts

The EV crown’s relocation tells us less about a single company’s destiny and more about an industry in transition. Expect more headline moments like this: the winners of the next decade will be those who combine scale, speed, and adaptability — and who can turn manufacturing muscle into global, trusted customer experiences.

Sources


Related update: We recently published an article that expands on this topic: read the latest post.



Related update: We recently published an article that expands on this topic: read the latest post.


Related update: We recently published an article that expands on this topic: read the latest post.


Related update: We recently published an article that expands on this topic: read the latest post.

Indias Growth Surge: Factories Fuel Boom | Analysis by Brian Moineau

India’s GDP Surprise: Factories, Festivals and a Fed of Optimism

Prime Minister Narendra Modi called the GDP number “very encouraging.” And who wouldn’t be? When official data showed India’s economy growing faster than most forecasters dared to predict, the reaction was equal parts relief and recalibration — for businesses, policymakers and investors trying to read what comes next.

Why this quarter felt different

  • India’s GDP surged 8.2% year‑on‑year in the July–September 2025 quarter, well above Bloomberg and consensus forecasts and the strongest pace in six quarters. (fortune.com)
  • The upswing was broad-based: private consumption jumped ahead of the festival season, manufacturing posted a sharp gain, and services remained resilient. Policy moves — tax cuts in September and a series of earlier rate reductions — helped juice demand. (fortune.com)
  • All of this happened while a strained trade backdrop loomed: a 50% U.S. tariff on many Indian imports complicates export prospects and adds uncertainty to the near term. Yet firms appear to have front‑loaded shipments and inventory activity, muting the immediate bite of tariffs. (fortune.com)

What the numbers really tell us

  • Short-term momentum: The combination of festive-season spending, tax cuts and prior interest‑rate easing produced a powerful near‑term boost. Manufacturing growth (9.1%) and a near‑8% jump in private consumption are the headline engines of the quarter. (fortune.com)
  • Not necessarily durable: Several economists warn the gains may fade once the one‑off effects — stockpiling before tariffs, festival demand, and statistical quirks like a lower GDP deflator — wash out. Forecasts for next fiscal year were nudged up, but multilateral institutions and rating agencies still flag downside risks if trade frictions persist. (fortune.com)
  • Policy implications: Strong growth reduces the urgency for an immediate rate cut by the Reserve Bank of India, though low inflation keeps room for easing open. Markets reacted by pricing a lower probability of an imminent cut. (fortune.com)

A closer look at the Trump tariffs effect

  • Timing matters: Many exporters shipped ahead of August’s tariff implementation, which created a temporary volume bump. That front‑loading shows up in the data, helping manufacturing and export‑related activity this quarter. (fortune.com)
  • Structural risk remains: If high U.S. tariffs endure, exporters will face sustained price and market‑access penalties. Multilateral forecasts (IMF WEO and Article IV assessments) reduced long‑run growth projections slightly under a scenario of prolonged tariffs. India’s domestic demand cushion can blunt but not fully negate export pain. (imf.org)
  • Winners and losers: Sectors with strong domestic market exposure (consumer goods, some services, domestic manufacturing) benefit most from the current setup. Labor‑intensive export sectors — textiles, gems and jewelry, seafood — are more exposed to tariff damage. (forbes.com)

When numbers and politics collide

  • Messaging matters: Modi’s “very encouraging” post on X is more than cheerleading. Strong quarterly prints bolster the government’s reform story (tax cuts, Make in India push) and strengthen negotiating leverage in trade talks. But politics also raises the bar for sustaining results; the state wants growth to look both robust and inclusive. (fortune.com)
  • External perceptions: International agencies still see India as one of the few bright spots in a slower world economy, even if they temper longer-term forecasts because of protectionist shocks. That positioning attracts capital and attention — until and unless trade barriers start redirecting supply chains away from India. (imf.org)

Practical implications for readers

  • For consumers: Strong demand helped by tax cuts means fresher buying power now, especially in urban centers during festival cycles. But keep an eye on inflation and employment signals over the next two quarters.
  • For business leaders: Don’t over‑interpret one robust quarter. Use the breathing room to invest in productivity, diversify export markets, and avoid over‑reliance on short‑term stockpiling gains.
  • For investors: Macro momentum and lower inflation create a constructive backdrop, but tariff‑driven export risk and potential capital flow swings mean selective exposure and active risk management make sense.

A few smart caveats

  • Some part of the headline jump may reflect statistical effects (lower GDP deflator and other discrepancy adjustments), so analysts are rightly cautious about extrapolating this pace forward. (fortune.com)
  • Forecasts vary: While the IMF projects India to remain a top growth performer in 2025–26 under its baseline, it also warns that sustained high tariffs shave projected growth thereafter. (imf.org)

My take

This quarter feels like a tactical win for India: policy levers and private consumption combined to outpace expectations, and manufacturing showed welcome life. But the strategic contest is just beginning. If India wants manufacturing-led, export‑driven growth to be durable, it needs two things: (1) trade diplomacy and adaptation to reclaim lost market access, and (2) faster local value‑chain deepening so that front‑loaded shipments don’t become the main growth story. Short of that, domestic resilience will keep India growing, but the trajectory will be bumpier than a single headline number suggests.

The bottom line

An 8.2% print is newsworthy and politically powerful. It buys space for reforms and investment. But read it as a strong quarter, not a guarantee of uninterrupted acceleration. The next few quarters — how tariffs play out, whether festival demand normalizes, and whether investment follows consumption — will tell us whether this was a steppingstone or a spike.

Sources


Related update: We recently published an article that expands on this topic: read the latest post.


Related update: We recently published an article that expands on this topic: read the latest post.


Related update: We recently published an article that expands on this topic: read the latest post.

U.S. International Trade in Goods and Services, July 2025 – Bureau of Economic Analysis (BEA) (.gov) | Analysis by Brian Moineau

U.S. International Trade in Goods and Services, July 2025 - Bureau of Economic Analysis (BEA) (.gov) | Analysis by Brian Moineau

Navigating the Trade Winds: The U.S. Trade Deficit's July 2025 Surge

Ah, the ever-evolving dance of international trade! Just when you think you've caught the rhythm, the tune changes, and you're left trying to catch up. That's precisely what happened in July 2025, as reported by the Bureau of Economic Analysis (BEA). The United States' goods and services deficit reached a staggering $78.3 billion, up $19.2 billion from June's revised figure of $59.1 billion. It's a number that has many economists scratching their heads and businesses reassessing their strategies.

The Big Picture


Before you let the numbers get you down, let's take a step back and look at the broader context. The trade deficit isn't just a standalone figure; it's a snapshot of a much larger global economic picture. With the world slowly recovering from the economic disruptions caused by the COVID-19 pandemic, international trade has been on a rollercoaster ride. Supply chains are still adjusting, and consumer demand is in flux.

In July, the increase in the trade deficit was primarily driven by a rise in imports outpacing exports. The U.S. imported more consumer goods, capital goods, and industrial supplies, reflecting a robust domestic demand. Meanwhile, exports did not experience the same level of growth, partly due to ongoing challenges in the global supply chain and varying recovery rates in different parts of the world.

The Global Tapestry


This jump in the trade deficit isn't happening in isolation. It's intertwined with global economic currents. For instance, the European Union, a major trading partner of the U.S., is navigating its own economic challenges, including energy crises and political shifts. These factors can influence the demand for U.S. exports.

In Asia, China, another key player in global trade, is experiencing a complex economic landscape marked by regulatory changes and geopolitical tensions. These dynamics can impact the flow of goods and services to and from the U.S.

The Dollar Dance


Another interesting angle to consider is the role of the U.S. dollar. A stronger dollar makes imports cheaper and exports more expensive, which can widen the trade deficit. In 2025, the dollar has maintained its strength, partly due to the Federal Reserve's monetary policy decisions. This strength, while beneficial for American consumers purchasing foreign goods, challenges U.S. exporters trying to compete in global markets.

Looking Forward


So, what does this all mean for the future of U.S. trade? The trade deficit is a complex beast, influenced by myriad factors beyond just imports and exports. Policies aimed at boosting domestic production, such as incentives for manufacturing and innovation, could help balance the scales. Additionally, diplomatic efforts to stabilize global trade relations are crucial.

On a lighter note, the ebb and flow of the trade deficit can also be seen as a testament to the interconnectedness of our world. It's a reminder that even as nations strive for self-sufficiency, the global marketplace is a shared space where cooperation and competition coexist.

Final Thoughts


As we sail these trade winds, it's essential to remember that numbers like the trade deficit are just one piece of the economic puzzle. They offer insights, yes, but they also prompt deeper questions about how we engage with the world and what strategies we employ to foster sustainable growth.

In the end, whether you're a business leader, policymaker, or curious global citizen, understanding these shifts in trade dynamics is vital. So, let's keep our eyes on the horizon, ready to adapt and thrive in this ever-changing global economy. As the saying goes, the only constant in life—and trade—is change.

Read more about AI in Business

Read more about Latest Sports Trends

Read more about Technology Innovations

China reports bumper April exports ahead of crucial trade talks with US – Financial Times | Analysis by Brian Moineau

China reports bumper April exports ahead of crucial trade talks with US - Financial Times | Analysis by Brian Moineau

Navigating the Trade Winds: China's Export Surge and the Global Chessboard

In a world where economic narratives are as dynamic as the tides, China's latest trade data offers a compelling chapter. According to the Financial Times, China's exports have experienced a remarkable surge in April, largely buoyed by increased shipments to Southeast Asia and Europe. This uptick comes at a particularly pivotal moment, just ahead of crucial trade talks with the United States. The timing couldn't be more interesting, as these negotiations could potentially reshape the contours of global trade.

Shifting Trade Currents

China's ability to offset a drop in exports to the United States with increases in other regions is a testament to its strategic maneuvering in the global market. As the world's factory, China has been adept at expanding its trade networks, and the current data underscores its resilience. The pivot to Southeast Asia and Europe is not just a reaction to strained US-China trade relations but also a reflection of China's long-term strategy to diversify its economic relationships. In recent years, China's Belt and Road Initiative has fostered stronger ties with these regions, providing a foundation for increased trade.

A Broader Context

This development in China's trade dynamics is happening against a backdrop of significant global economic shifts. For instance, Europe is increasingly looking to strengthen its own economic ties within Asia, as seen in the EU's recent investment agreements with Vietnam and other Southeast Asian nations. Meanwhile, the United States is recalibrating its trade policies, focusing on reshoring industries and reducing dependency on foreign manufacturing, particularly from China.

The trade talks between China and the US are a microcosm of a larger geopolitical chess game. Both nations are vying for economic supremacy, but they are also aware of their intertwined destinies. The global supply chain disruptions caused by the COVID-19 pandemic have added an extra layer of urgency to these discussions, reminding all parties of the need for a more resilient and diversified global economy.

Global Trade and Innovation

China's export resilience is also indicative of its growing prowess in innovation. Over the past decade, China has shifted from being primarily a manufacturer of low-cost goods to becoming a hub of technological advancement. This evolution is evident in its export profiles, which now include high-tech products and green technology solutions. As countries worldwide strive to meet climate goals, China's role as a leader in renewable energy exports cannot be overlooked.

Final Thoughts

As China and the United States prepare for their trade discussions, the world watches with bated breath. The outcome of these talks will not only influence bilateral relations but also set the tone for the future of global trade. China's export strategy, with its focus on diversification and innovation, exemplifies the changing nature of international commerce. In an interconnected world, the ripples of these economic decisions will be felt far and wide.

In conclusion, the April export data serves as a reminder of the ever-evolving landscape of global trade. As nations navigate these waters, the need for collaboration and strategic foresight becomes paramount. While the winds of change are unpredictable, they also bring the promise of new opportunities for those willing to adapt.

Read more about AI in Business

Read more about Latest Sports Trends

Read more about Technology Innovations