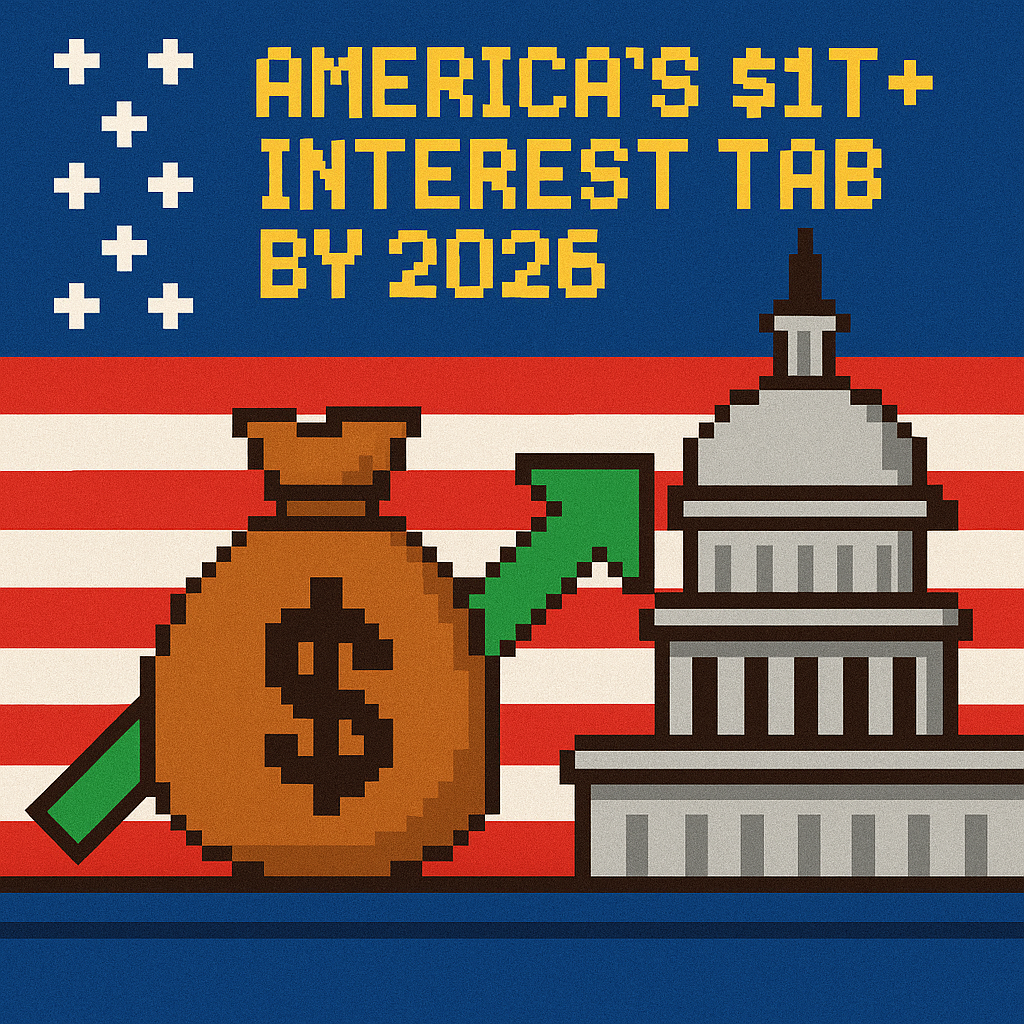
America’s $1T+ Interest Tab by 2026 | Analysis by Brian Moineau

TL;DR

  • Bessent’s Treasury is borrowing at a clip that makes net interest the fastest-growing federal bill, now bigger than year‑to‑date defense outlays—and taxpayers are already footing it [2].
  • The real squeeze isn’t “debt apocalypse”; it’s financing mechanics: coupon sizes are frozen into 2026, pushing a refinancing wave into 2027 when rates may still be sticky [3][4].
  • Back‑of‑envelope: if 9‑month net interest is $857B, FY2026 likely tops ~$1.14T—about $8.5K per U.S. household—before any new programs, tax cuts, or wars enter the chat [2][10].

What the source said

TheStreet’s piece argues the “troubling news for every taxpayer” is the interest bill itself and points to the CBO’s June 2026 Monthly Budget Review showing a $1.4 trillion deficit for the first nine months of the fiscal year and $857 billion in net interest, roughly $23.8 billion a week and up 13% year over year [1][2]. It notes that total federal debt is near $39.4 trillion and that year‑to‑date net interest has surpassed defense spending in the same period [1][2]. The article references CRFB’s warning that full‑year borrowing could exceed $2 trillion and cites longer‑term CBO projections showing interest costs roughly doubling by 2036, with Social Security’s OASI trust fund projected to hit insolvency in 2032 if laws remain unchanged [1][7][8].

Why it matters

Stakeholders aren’t abstract “taxpayers”; they’re workers whose FICA payroll taxes fund Medicare and Social Security, retirees whose checks depend on the OASI and DI trust funds, and households facing higher “interest taxes” in the form of rising federal carry costs each year [2][8]. The CBO ledger for FY2026 to date shows interest already outruns discretionary fights over EPA, Education, or Commerce; those culture‑war skirmishes won’t reclaim real money if the interest line keeps compounding at a double‑digit clip [2].

Markets, too, have agency. Primary dealers and bond funds absorb the supply that Bessent’s team ships each week via bills, notes, and bonds, and TBAC minutes indicate dealers expect larger coupon auctions in early 2027 [3]. That means price risk today and term‑premia tomorrow, with the bill landing in the public’s lap via higher interest outlays that crowd out choices elsewhere, including discretionary spending in FY2027–2028 [3][6].

Original analysis

  • Back‑of‑envelope math

    • Nine months into FY2026, net interest totals $857B. Annualizing: $857B ÷ 9 × 12 ≈ $1.142T for the full year (directionally conservative if rates or issuance tick up) [2].
    • Households: FRED shows ~134.79 million U.S. households in 2025. $1.142T ÷ 134.79M ≈ $8,470 per household in FY2026—pure carry cost, not new services [10].
  • Contrarian read

    • Consensus: “Debt is unsustainable; immediate austerity or crisis is inevitable.”
    • Counter: Over the next 12 months, the binding constraint is issuance plumbing, not instant insolvency. Treasury said it will keep note/bond auction sizes steady for “several more quarters,” even as TBAC’s discussion flags a ~$1.3 trillion funding shortfall over FY2027–2028 if current sizes persist [3][4]. Translation: the tough part got kicked into 2027, when terming out becomes unavoidable—and if 10‑year yields stay elevated, coupons will reset higher right as more supply arrives [3][4].
  • A named‑stakeholder breakdown

    • Scott Bessent, Treasury Secretary: He is selling into a rising‑rate, deficit‑heavy backdrop with limited levers beyond maturity mix, buybacks timing, and messaging that calms dealers; his “financial literacy” push won’t bend the interest curve, but execution on issuance strategy will [5][6].
    • TBAC (Treasury Borrowing Advisory Committee): Its May 2026 minutes telegraphed that dealers expect larger coupon sizes early 2027; if realized, that locks in more high‑coupon debt and lifts interest costs structurally into the 2030s [3].
    • CBO: It just printed the scoreboard—$1.4T nine‑month deficit, $857B net interest, and interest > defense year‑to‑date; its 10‑year baseline has net interest jumping from roughly $1.0T in 2026 to about $2.1T by 2036 at 4.6% of GDP, surpassing prior peaks [2][8].
    • CRFB (Maya MacGuineas): The outside push to keep borrowing under roughly $2T in FY2026 sharpens the political choice—trim now or accept higher carry costs in 2027–2028 [7].
  • Historical analogue

    • In the early 1990s, net interest peaked near about 3.2% of GDP and then ebbed as growth and falling yields did the heavy lifting from 1992 through 2000; CBO now projects roughly 3.3% in 2026 rising toward 4.6% by 2036 [8][9]. The 1990s playbook—grow out and refinance down—rode a secular disinflation tailwind; today’s baseline bakes in higher average rates, so the “grow and roll” cushion is thinner [8][9].
  • A simple 2×2: rates path vs. issuance mix

    • High rates + bill‑heavy: Best near‑term auctions, worst pass‑through to interest costs; FY2027 refi pain rises.
    • High rates + term‑out now: Higher coupons today, but reduced refi risk if the Fed eases late.
    • Lower rates + bill‑heavy: Wins everywhere; but you must be lucky on timing.
    • Lower rates + term‑out: Overpays briefly, but stabilizes carry; the conservative CFO’s choice.

Treasury’s current stance—hold coupons steady and lean on bills—prioritizes auction smoothness over long‑run carry, which assumes demand for U.S. duration remains adequate and disinflation continues through 2026 [3][4][6]. If that assumption fails and 10‑year yields hover near recent highs into 2027, taxpayers inherit a bigger, stickier interest bill for years [3][8].

What others are missing

Coverage fixates on the deficit topline. The subtler story is the composition shift underneath: CBO category tables show corporate income tax receipts down about 24% year‑to‑date versus last year due to 2025 law changes that boosted deductions, while individual/payroll taxes carried more weight until a February 2026 court ruling triggered roughly $70 billion in customs refunds that hit net tariff revenue [2]. That cocktail tilts financing toward bills and away from locking in term even as net interest outlays climb 13% year over year through June 2026, raising rollover risk into the 2027 refunding window [2][3].

What to watch next

  1. By September 30, 2026, net interest outlays reported in the Monthly Treasury Statement will exceed $1.12 trillion for FY2026 [2].
  2. By the February 2027 Quarterly Refunding, Treasury will announce increases to nominal coupon auction sizes (at least the 2‑year and 5‑year tenors), reversing 2026’s “steady for several quarters” guidance [3][4].
  3. By June 2027, CBO’s Monthly Budget Review will show corporate income tax receipts at least 15% below the same period two years earlier (June 2025), keeping pressure on bill issuance and net interest [2].

My take

If I ran Bessent’s Treasury, I’d front‑load some pain in 2026—nudge up coupons and lengthen maturities while market depth is intact—rather than gamble on a perfect 2027 [3][4]. The CBO scoreboard says interest is already outrunning defense, and the TBAC roadmap says the real refinance hit is coming within four quarters; trim the bill share, accept a few ugly auctions now, and buy rate insurance before the economy proves sticky [2][3][8]. Pair that with a modest, bipartisan PAYGO rule so new tax cuts or credits don’t feed the interest line. Otherwise households are staring at an $8K‑plus annual “interest tax” with nothing to show for it in FY2026–2027 [2][10].

Sources

  1. Bessent’s Treasury has troubling news for every taxpayer — TheStreet (https://www.thestreet.com/taxes/bessents-treasury-has-troubling-news-for-every-taxpayer) — Frames net interest as the taxpayer’s real bill and cites up‑to‑date deficit and debt figures.
  2. Monthly Budget Review: June 2026 — Congressional Budget Office (https://www.cbo.gov/system/files/2026-07/61982-MBR.pdf) — Confirms $1.4T nine‑month deficit, $857B net interest (up 13% YoY), and interest outlays surpassing defense year‑to‑date.
  3. Minutes of the Meeting of the Treasury Borrowing Advisory Committee, May 5, 2026 — U.S. Treasury (https://home.treasury.gov/news/press-releases/sb0491) — Details dealer expectations for 2027 coupon size increases and a ~$1.3T funding gap under current sizes.
  4. U.S. Treasury keeps auction sizes steady; dealers expect change in early 2027 — Kitco News (https://www.kitco.com/news/off-the-wire/2026-05-06/us-treasury-keeps-auction-sizes-steady-dealers-expect-change-early) — Reports on Treasury’s “several more quarters” guidance and market positioning.
  5. Bessent wants Americans to avoid easy‑money traps and invest in financial literacy — Washington Post (https://www.washingtonpost.com/business/2026/05/01/bessent-treasury-secretary-profile/) — Profiles Scott Bessent’s agenda and public messaging constraints.
  6. Bessent Has Limited Options to Halt Climb in Treasury Yields — Bloomberg News (https://news.bloomberglaw.com/capital-markets/bessent-has-limited-options-to-halt-climb-in-treasury-yields) — Explains rising yields and the narrow toolkit Treasury has to influence them.
  7. CBO Estimates FY 2026 Deficit Overtakes 2025, Totals $1.4 Trillion — CRFB (https://www.crfb.org/press-releases/cbo-estimates-fy-2026-deficit-overtakes-2025-totals-14-trillion) — Provides outside analysis warning FY2026 borrowing may exceed $2T.
  8. Director’s Statement on the Budget and Economic Outlook: 2026–2036 — CBO (https://www.cbo.gov/publication/62050) — Projects net interest rising from ≈$1.0T in 2026 to ≈$2.1T by 2036, from 3.3% to 4.6% of GDP.
  9. An Update on the Federal Budget Outlook (March 2026) — Brookings/TPC (https://www.brookings.edu/wp-content/uploads/2026/03/20260311_TPC_GaleAuerbach_FiscalOutlook_FINAL1.pdf) — Notes the prior historical peak of net interest at ≈3.2% of GDP in the early 1990s.
  10. Total Households (TTLHH) — FRED, St. Louis Fed (https://fred.stlouisfed.org/series/TTLHH/) — Supplies the ≈134.79 million household count used for per‑household cost estimates.


Related update: We recently published an article that expands on this topic: read the latest post.

Related update: We recently published an article that expands on this topic: read the latest post.

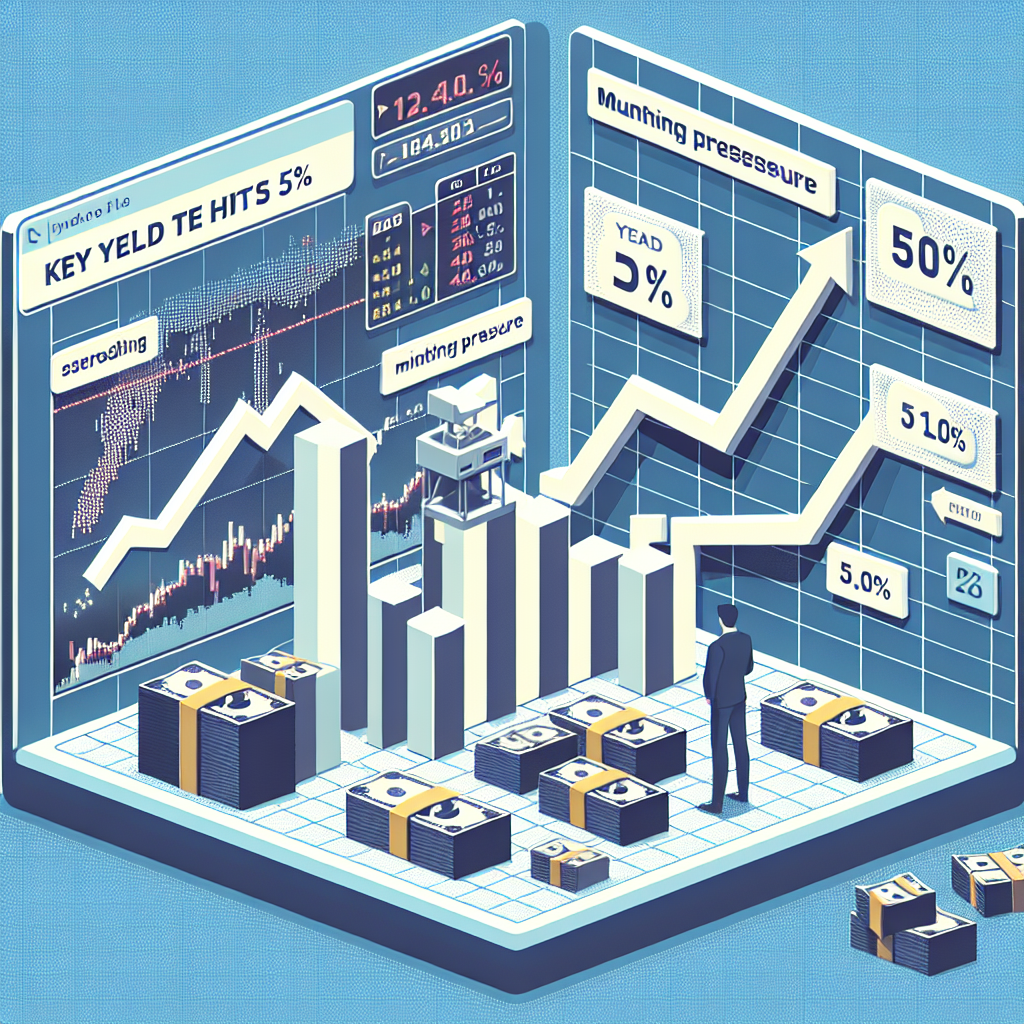
30-Year Yield at 5%: Pressure on Borrowing | Analysis by Brian Moineau

The long end is talking: why the 30‑year yield hovering around 5% matters

The yield on 30‑year US government debt hovered around 5% this week, and that simple sentence carries a lot of freight. Long‑term Treasury yields aren’t just an abstract market statistic — they’re a price signal that ripples into mortgage rates, corporate borrowing costs, pension funding, and how investors price risk across the global economy. When the 30‑year yield touches a round number like 5%, markets and money managers pay attention because it’s both psychological and practical: borrowing math changes, balance sheets flex, and strategy conversations shift.

Let’s walk through why this move is more than noise, what’s driving it, and what to watch next.

Why a 5% 30‑year yield is news

  • A higher 30‑year yield means the government pays more to borrow for three decades. That raises the baseline for long‑term interest rates across the economy.
  • Mortgage rates tend to track the long end; when the 30‑year Treasury rises, so does the cost of a 30‑year fixed mortgage, squeezing housing affordability.
  • Pension plans and insurers mark long liabilities to market prices; sustained higher yields alter funding ratios and the economics of fixed‑income allocations.
  • The long end reflects expectations about inflation, growth, fiscal policy and global demand for safe assets — it’s where the “what‑do‑we‑really‑expect over decades” conversation happens.

Put simply: moves at the long end force investors and policymakers to re‑ask the question, “How expensive will money be for the next generation?”

The yield on 30‑year US government debt hovered around 5% — what pushed it there?

Several factors have conspired to nudge the long‑end higher:

  • Inflation and inflation expectations: Even if headline CPI has cooled from its peak, stickier or unpredictable prices keep investors demanding higher compensation for tying money up for 30 years.
  • Fed policy and rate path bets: If markets push back expectations for Federal Reserve rate cuts — or see a risk the Fed may stay restrictive longer — long yields can rise as investors price in a higher neutral rate or slower easing.
  • Fiscal dynamics and issuance: Large or persistent deficits mean more Treasury supply. If global demand for long‑dated paper softens, yields need to move up to attract buyers.
  • Geopolitical and market stress: Events that change risk perceptions (commodity shocks, trade disruptions, regional conflicts) can alter both inflation expectations and safe‑asset flows, putting upward pressure on long yields.
  • Technicals and liquidity: Auction weakens, lower foreign buying, or flows out of long‑duration ETFs can amplify a move once it starts.

Those forces don’t act in isolation. The market is sensitive to small changes in each — and when they line up, the long end can move quickly.

What it means for everyday markets and people

  • Mortgages and housing: Long‑term mortgage rates often move with the 30‑year Treasury. A sustained rise toward or above this 5% zone lifts monthly payments for new homebuyers and can chill refinancing activity.
  • Corporate borrowing and investment: Companies issuing long‑dated bonds face higher interest costs, which can alter capital expenditure plans and valuations.
  • Risk assets: Higher long yields can make bonds more attractive versus stocks, or at least raise the hurdle rate for equities — especially for growth companies whose valuations rely on low discount rates.
  • Government interest expense: Higher long yields increase the present value cost of future debt. For a large issuer like the U.S., that matters for budget math if yields stay elevated.
  • Savers and retirees: Higher yields on long Treasuries can be a silver lining for savers who can ladder or buy duration; but pension plans may mark down liabilities, creating funding headaches.

A closer look at the signal: is this a temporary blip or a regime shift?

This is the central debate. A few ways to think about it:

  • Temporary shock view: If the rise is driven by a transitory supply/demand mismatch, geopolitical blip, or a momentary repricing of Fed timing, yields can retreat once the shock subsides.
  • Structural view: If the market is re‑establishing a higher equilibrium for long rates — because inflation expectations have permanently risen, fiscal pressures are larger, or the global appetite for long duration has waned — then 5% may be the new normal for the long end (or a floor, not a ceiling).

History shows both patterns: yields spike and fall around shocks, but they also trend to new ranges when the macro backdrop changes. The cadence of incoming inflation data, the Fed’s communications and Washington’s fiscal trajectory will be the deciding factors.

What investors and policymakers should watch next

  • Inflation prints and the Fed’s language about policy normalization or cuts.
  • Treasury auction results and demand from core buyers (domestic real money managers, foreign central banks).
  • Data on mortgage rates and housing activity — they’ll reveal how the rate move is transmitting to the real economy.
  • The shape of the yield curve: persistent steepening or flattening tells different stories about growth and recession risk.
  • Global yields: long bonds elsewhere moving higher can validate a global re‑pricing, while an isolated U.S. rise points to domestic fiscal or policy drivers.

Market mood and strategy implications

  • For fixed‑income investors: higher long yields reopen income opportunities — ladders and high‑quality duration can become attractive again — but timing matters if volatility spikes.
  • For equity investors: reassess duration risk in portfolios, favor cash‑generating businesses if discount rates rise, and watch sectors more sensitive to financing costs.
  • For households: locking mortgage rates or reassessing refinancing math may make sense if you expect yields to stay higher for months.
  • For policymakers: a durable rise in long yields forces honest conversations about deficit paths and monetary‑fiscal interactions.

My take

The 30‑year yield flirting with 5% is a reminder that the bond market often gets ignored until it tugs on the rest of the economy. This isn’t an automatic recession signal — but it is a market vote demanding clarity. Investors and policymakers should treat the move as both a risk and an opportunity: risk if it’s the start of a sustained repricing that pressures growth; opportunity if elevated yields buy savers and long‑duration buyers income they haven’t seen in years.

In short: markets are asking for a clearer plan — on inflation, on Fed timing, and on fiscal responsibility. How those answers arrive will determine whether 5% is a headline or the new baseline.

A few practical takeaways

  • Revisit duration exposure: consider whether you want to lock yields now or wait for volatility to subside.
  • Homebuyers: check refinance vs. purchase math quickly — small yield moves change monthly payments meaningfully.
  • Watch the data calendar: inflation, payrolls, and Treasury auctions will shape the next moves.

Sources


Related update: We recently published an article that expands on this topic: read the latest post.


Related update: We recently published an article that expands on this topic: read the latest post.

Japan’s bond market ignites fears of outflows from U.S., carry trade unwind and market turmoil – CNBC | Analysis by Brian Moineau

Japan's bond market ignites fears of outflows from U.S., carry trade unwind and market turmoil - CNBC | Analysis by Brian Moineau

Title: The Rising Tide of Japan's Bond Market: A Tsunami for Global Investments?

In the ever-dynamic world of global finance, a new ripple is making waves. As Japan's government bond yields climb, investors around the globe are holding their breath, anticipating a potential capital shift that could make or break markets. If you've been watching the financial headlines lately, you might have come across CNBC's coverage of these brewing concerns. Higher yields in Japan could trigger a capital repatriation, pulling funds from the U.S. and setting off a chain reaction that could unwind the famed "carry trade" and stir up market turmoil.

But before we jump to conclusions, let's take a step back and explore what this means in layman's terms. For years, Japanese investors have taken advantage of the lower interest rates at home to invest in higher-yielding assets abroad, particularly in the U.S. This strategy, known as the carry trade, has been a lucrative venture, providing steady returns with relatively low risk. However, with Japan's bond yields on the rise, the equation might be changing.

Imagine a Japanese investor who once enjoyed a pleasant stroll on a beach with a gentle tide (low yields at home and high yields abroad). Suddenly, the tide turns, and they find themselves knee-deep in water as yields rise back home. Naturally, they might consider retreating back to safer, drier ground—repatriating their capital to Japan. This could mean a massive outflow of funds from U.S. markets, which would send shockwaves through global finance.

To put this in perspective, it's akin to the global sensation of Taylor Swift's concerts causing seismic shifts in local economies. Just as the "Swift effect" can boost a city's revenue and tourism, a shift in investment flows can dramatically impact financial markets. However, unlike a concert, financial markets thrive on stability and predictability, and unexpected shifts can lead to volatility and uncertainty.

But this isn't just a story about numbers and percentages. It's also a tale woven into the fabric of our interconnected world. For example, the U.S. is currently navigating its own set of challenges, from inflation concerns to political debates about fiscal policy. A sudden capital outflow could add pressure to an already strained economic system. Moreover, this scenario is reminiscent of the 1997 Asian Financial Crisis, where rapid capital movements led to economic turmoil in several Asian economies.

Meanwhile, across the globe, investors are also keeping an eye on Europe, where the European Central Bank is navigating its own challenges. The eurozone is experiencing slow growth and geopolitical tensions, which further complicate the investment landscape. In this global chess game, every move counts, and Japan's bond market shift is a significant one.

In conclusion, while the prospect of capital repatriation from the U.S. due to rising Japanese bond yields is a serious concern, it's essential to maintain perspective. Financial markets are complex, and myriad factors are at play. Investors and policymakers must remain vigilant and adaptable, much like a surfer riding unpredictable waves. After all, in the world of finance, as in life, change is the only constant. Let's hope that as the tide rises, we'll all be ready to ride the wave rather than be swept away. 🌊

---

Final Thought: As Japan's bond market dynamics continue to unfold, it's a reminder of the delicate balance in global finance. Investors must stay informed and agile, ready to pivot with the tides. Just as in nature, financial ecosystems thrive on adaptability and resilience. Here's to navigating the waves with both caution and curiosity.

Read more about AI in Business

Read more about Latest Sports Trends

Read more about Technology Innovations