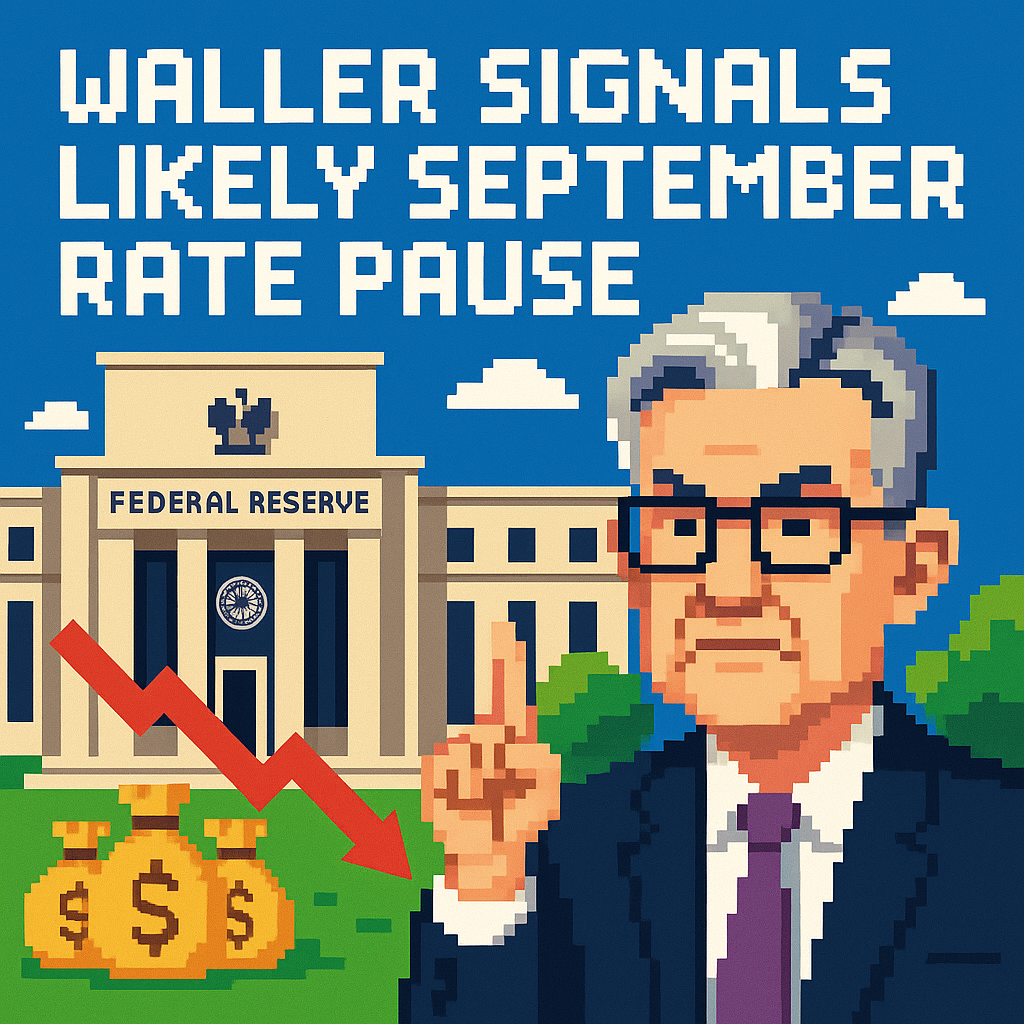
Waller Signals Likely September Rate Pause | Analysis by Brian Moineau

TL;DR

  • Federal Reserve Governor Christopher Waller said he was inclined to hold rates at the mid-September 2026 FOMC if August inflation cools, countering Kevin Warsh’s hawkish Jackson Hole tone that pushed markets toward a September hike. [1][3]
  • CME-linked odds for a September increase jumped near 58% after Warsh’s Jackson Hole remarks, then drifted back toward roughly 50% after Waller’s comments. [3][2]
  • My read: data-dependent voices like Waller will carry the month unless core inflation re-accelerates materially in the next print; markets look a bit rich on hike odds here. [1][2]

What the source said

The Financial Times reported that Governor Waller indicated he was inclined to keep the federal funds rate unchanged in September 2026 if incoming August inflation data confirm cooling, and it contrasted that signal with markets’ post–Jackson Hole shift toward a hike. [1]
Coverage noted that Warsh’s hawkish posture in Jackson Hole, Wyoming, on August 28, 2026, helped push hike odds higher before Waller’s remarks pared them. [3]
Waller explicitly grounded his September stance in the next CPI/PCE readings and acknowledged softer labor data, with July’s U.S. unemployment rate near 4.1%. [2]
Net: the FT framed an active policy debate—Warsh’s toughness nudged probabilities up; Waller’s conditional patience leaned them back toward a hold pending next week’s inflation report. [1]

Why it matters

A 25 basis point hike or hold in September 2026 changes mortgage quotes, corporate funding costs, and bank hedging right now, not in theory. The split between Warsh’s tougher stance and Waller’s data-first posture pulls the Treasury curve, which feeds into housing affordability, small‑business credit, and capex decisions in cities like Dallas and Detroit. [2][3]
Pricing moves of a few basis points affect real money: dealers, asset managers, and regional lenders must adjust risk on the fly when odds swing 8–10 percentage points in a single session. [2][3]

Investors also have to parse a communications shift after Jackson Hole. Warsh downplayed forward guidance and emphasized discipline, which increases the premium on each CPI and PCE print. [3]
That stance amplifies the influence of officials like Waller who translate data into conditional policy, and it heightens whiplash risk as traders chase each speech, tightening financial conditions via volatility even without a formal hike. [1][3]

Original analysis

Contrarian read — the consensus and why I disagree

  • Consensus: Warsh’s Jackson Hole hawkishness tipped the odds toward a September hike, with CME-linked probabilities near 57–58% intraday. [3]
  • My case: Waller supplied the data-contingent anchor and odds slid back toward even-money after his remarks; if August core CPI runs ~0.20–0.25% m/m, a voting majority will back a hold over a preemptive hike. [1][2]
  • Labor adds cover: with July unemployment around 4.1% and signs of easing job openings, a “watchful hold” minimizes regret while keeping optionality. [2]

Back-of-envelope calculation — how much “hike risk” is actually priced

  • After Jackson Hole: implied odds of a 25 bp September hike ≈ 58%; expected move = 0.58 × 25 bp ≈ 14.5 bp. [3]
  • After Waller’s pushback: pricing cooled to ≈ 50%; expected move = 0.50 × 25 bp = 12.5 bp. [2]
  • Delta ≈ 2 bp; with a two‑year Treasury duration ~1.9, price impact ≈ 1.9 × 0.0002 = 0.00038, or 0.038%. On a $250,000,000 position, mark‑to‑market ≈ $95,000 (author’s calculation using duration × yield change).

Back-of-envelope calculation — the household translation

  • Assume a $400,000, 30‑year fixed mortgage priced at 7.00% if the Fed holds versus 7.25% if it hikes 25 bp.
  • Payment at 7.00%: r = 0.07/12; n = 360 → about $2,663/month.
  • Payment at 7.25%: r = 0.0725/12; n = 360 → about $2,729/month.
  • Difference ≈ $66/month, or ~$800/year—material for first‑time buyers deciding whether to lock in September 2026 (author’s calculation).

Named‑stakeholder breakdown — what this means right now

  • Homebuilders (D.R. Horton, Lennar): A September hold steadies rate locks into the autumn selling season; a hike risks cancellations and heavier incentives. Watch MBA weekly applications and order backlogs in Q3.
  • Regional banks (PNC, Fifth Third): A hold stabilizes deposit betas; a hike nudges NIM but worsens AFS/HTM marks, pressuring tangible common equity optics into Q4.
  • AI‑buildout supply chain (Nvidia, Broadcom, Eaton): Warsh linked late‑cycle demand risks to frothy investment; a hike cools multiples and debt‑financed data‑center capex, while a hold stretches the runway for 2027–2028 plans. [3]
  • Utilities and yield proxies (NextEra, Duke): Even a 2–3 bp shift in expected policy bleeds into equity risk premia; a hold supports defensives that sold off when hike odds spiked. [2][3]
  • High‑yield issuers (private credit funds; B‑rated borrowers): A hold preserves refinancing windows into Q4 2026; a hike raises coupons into clustered maturities.

Historical analogue — how guidance risk feeds term premia

  • In 2013’s “taper tantrum,” less‑predictable guidance widened term premia even as the expected policy path shifted modestly; the 10‑year yield rose over 100 bp from May to September 2013 while the funds rate stayed pinned.
  • In 2017, the Fed’s balance‑sheet normalization plan muted that volatility by pre‑announcing caps; today’s retreat from specificity rhymes more with 2013 than 2017, arguing for a fatter term premium into 2026–2027.

A simple typology for the Fed’s current split

  • Pragmatic data‑first (Waller): Votes hinge on the next CPI/PCE; communicates thresholds like “if continued progress, hold.” [1][2]
  • Credibility‑first (Warsh): Emphasizes vigilance on inflation and accepts more market volatility as the cost of policy flexibility. [3]
  • Markets ping‑pong between these poles, which is why odds lurched to ~58% post–Jackson Hole, then cooled toward ~50% after Waller. Position sizing should reflect that tug‑of‑war rather than a single static reaction function. [3][2]

What others are missing

Most coverage fixates on the September 2026 binary. The bigger story is how Warsh’s retreat from forward guidance changes the entire term structure by design, raising communication uncertainty that feeds the term premium even if the modal path for the funds rate barely shifts. [3]
Waller’s conditional clarity briefly filled that vacuum, but the structural takeaway is fewer breadcrumbs and fatter premia, which matter for 10‑year mortgages, 20‑ to 30‑year project finance, and multi‑decade utility rate cases that discount far‑out cash flows. [1][3]
Even if the FOMC holds on September 16, a higher term premium can keep borrowing costs elevated and price‑to‑earnings multiples subdued into 2027, especially in capital‑intensive sectors.

What to watch next

  1. By September 13, 2026: Core CPI prints at or below 0.25% m/m SA; if that happens, September hike odds fall below 40% by the September 14 open.
  2. By September 16, 2026: FOMC holds the target range; the statement adds a data‑contingent “willingness to act” clause without new forward guidance.
  3. By October 31, 2026: The two‑year Treasury yield stays within ±15 bp of its September 9 close, signaling a narrow realized policy path despite noisier Fed rhetoric.

My take

I side with Waller’s conditional hold. Banking disinflation progress while unemployment hovers near 4.1% reduces overshoot risk and buys time to see whether shelter and non‑market services cool into Q4 2026. [2]
Warsh’s concern about credibility is understandable, but a preemptive hike into moderating core could tighten more than intended, especially with AI‑linked capex muddling relative prices. If August core lands near 0.20–0.25% m/m, expect a steady hand and a statement that keeps the hawkish umbrella open—but furled. [1][2]

Sources

  1. Financial Times — “Fed’s Chris Waller inclined to hold rates if inflation cools” (September 2026). What this contributes: primary report on Waller’s conditional hold stance and its timing.
  2. AP News — Coverage of Waller’s remarks and market reaction (September 2026). What this contributes: odds near 50%, July unemployment near 4.1%, and context on shifting expectations.
  3. Kiplinger — “Stocks turn down as Warsh talks up rates: Stock Market Today” (late August 2026). What this contributes: link between Warsh’s Jackson Hole tone and CME FedWatch odds around 57–58%.

Anthropic’s $2T IPO Poised to Reshape AI | Analysis by Brian Moineau

TL;DR

  • Fortune reports that Anthropic is targeting an October 2026 IPO at a $2 trillion valuation—larger than Saudi Aramco’s $1.7 trillion debut in 2019 and set up to overshadow SpaceX’s float chatter. [1][3][4]
  • At $2T, Anthropic must turn rapid model adoption into durable free cash flow in a market constrained by power and grid gear; PJM’s interconnection queue surpassed 300 GW in 2024 and U.S. transformer lead times stretched past 100 weeks. [7][8]
  • If the deal prices near $2T, the center of gravity in enterprise AI shifts toward cloud partners, chip vendors, and utilities—namely AWS, Google Cloud/TPU, NVIDIA, and regional grid operators—not just app developers. [2][5][7]

What the source said

Fortune says Anthropic is preparing a $2 trillion IPO in October 2026, which would make it the largest listing on record and a capstone to a year of venture-backed exits. The piece ties the bid to enterprise AI traction, positions it against SpaceX’s own IPO timeline, and frames the listing as a test of how public markets price foundational AI vendors. It emphasizes the record-setting nature of the target and the potential market impact on tech indices. [1]

Why it matters

A $2 trillion Anthropic IPO would reset how markets price vertically integrated compute businesses that span models, training clusters, and power contracts. The decisive stakeholders include AWS and Google (distribution and pre-buys), NVIDIA and memory suppliers (unit costs), PJM and CAISO (capacity and interconnection), and CIOs negotiating multi‑year AI commitments in 2026 budgets. [2][5][7]

If pricing lands near $2T, pension funds and sovereigns must decide whether AI infrastructure behaves like software (70%+ gross margins) or like utilities (capital cycles and regulatory bottlenecks). That call will influence index weights, rivals’ capital costs at OpenAI and xAI, and whether Wall Street treats model providers as cash machines or as projects tied to megawatts and substations. [3][7]

Original analysis

Anthropic $2 trillion IPO: back-of-the-envelope math

  • Required return framing: At a 10% cost of capital, a $2T valuation implies ~$200B in steady-state annual free cash flow (FCF) to justify price (2,000 ÷ 10%).
  • Margin bridge: At a 25% FCF margin, that back-solves to ~$800B in annual revenue at maturity ($200B ÷ 0.25). Even if Anthropic reaches $100B revenue by 2030, it would need to 8x from there, unless margins rise or capex falls.
  • Sensitivity: At a 30% FCF margin and 9% required return, implied FCF falls to ~$180B ($2,000B × 0.09), which still demands multi‑hundred‑billion revenue. Buyers will scrutinize gross margins versus chip, power, and datacenter costs, alongside enterprise pricing pushback already flagged by Axios in 2024. [6]

These are assumptions, not forecasts, but they spotlight what “$2T” demands operationally: multi‑hundred‑billion revenue plus infrastructure discipline and cash conversion.

Historical analogue: Saudi Aramco, 2019

Saudi Aramco listed at ~$1.7T in December 2019 and raised $25.6B, underpinned by state backing, dividend commitments, and stable upstream economics. [4] Anthropic faces the inverse profile in 2026: regulatory flux, component scarcity, and learning curves in flux. Aramco offered bond‑like cash flows; Anthropic offers growth tied to compute and power cycles. Expect narrative‑driven trading and higher volatility in the first 12–18 months after listing.

Contrarian read

  • Consensus: A $2T IPO would crown Anthropic as the default enterprise AI platform, with hyperscaler distribution supporting margins.
  • Contra: The gating factor is not GPUs; it’s the grid. Reuters detailed U.S. transformer and switchgear bottlenecks and utility interconnection delays as AI data centers balloon, driving multi‑year queues and capex bloat that compress unit economics—right when public investors demand operating leverage. [8]

Named-stakeholder breakdown

  • Amazon (AWS Bedrock): Gains consumption and marquee workloads if Anthropic grows; risks margin pressure if Anthropic negotiates preferential GPU and power allocations or commits to multi‑year reserved instances. [2]
  • Google Cloud/TPU: Strengthens multi‑sourcing leverage with TPUs and cloud credits; Anthropic disclosures could reveal the degree of subsidy required to win training jobs in 2026. [5]
  • NVIDIA: Anthropic’s scale supports demand for H200/HX and Blackwell shipments through 2027, but power and interconnection limits may cap effective utilization, extending order backlogs. [8]
  • SpaceX: A $2T Anthropic would overshadow a rumored $1.75T SpaceX target, intensifying pressure to prove satellite, launch, and AI adjacency synergies at IPO. [3]
  • Fortune 500 CIOs: Better disclosure on cost of goods sold, reserved capacity, and energy contracts could standardize enterprise AI pricing and strengthen procurement leverage in 2027 renewals. [6]

A simple 2×2: What the IPO is really pricing

Capital intensity (datacenters, power) Pricing power (enterprise AI contracts) What investors are buying
High High “AI utility” with software margins—requires hyperscaler concessions and reliable power
High Low Margin squeeze—valuation mean reversion risk
Low High Software dream scenario—unlikely at Anthropic’s 2026 scale
Low Low Bubble case—unsustainable at $2T

Anthropic’s current reality sits in the top-left cell. The $2T question is whether it can stay there long enough for operating leverage to appear.

What others are missing

Most coverage centers on GPUs and supply allocations, but the tighter choke point is electrical balance‑of‑plant and utility interconnection. Reuters has documented 100+ week transformer lead times and switchgear shortages, while PJM’s 2024 queue shows triple‑digit gigawatts of pending load and generation awaiting study. [7][8] The overlooked angle is substation readiness and 230–500 kV build cycles that determine when new training clusters can actually energize. [7][8]

What to watch next

  1. By December 31, 2026, at least two U.S. utilities in PJM or ERCOT will disclose AI data center interconnection deferrals exceeding 12 months due to transformer or switchgear constraints, in rate filings or public board updates. [7][8]
  2. By March 31, 2027, Anthropic will report, in S‑1 or first 10‑K, a minimum of one multi‑year energy or capacity agreement (PPA or equivalent) exceeding 200 MW nameplate tied to training operations.
  3. By June 30, 2027, at least one hyperscaler (AWS or Google Cloud) will revise enterprise AI pricing or discount structures publicly to address unit‑economics pushback, citing cost transparency or contractual minimums. [2][5][6]

Sources

[1] Fortune — Report on Anthropic’s planned October 2026 IPO and $2T target valuation; establishes the headline claim and timing.
[2] Amazon — 2023–2024 announcements on AWS Bedrock and Amazon’s up-to-$4B investment in Anthropic; details distribution, credits, and capacity commitments.
[3] Reuters — Coverage of SpaceX/Starlink IPO timing and valuation speculation circa 2025–2026; provides the comparative benchmark for “eclipse SpaceX.”
[4] Saudi Aramco — 2019 IPO disclosures and financial reporting; supplies the $1.7T listing and $25.6B raise for historical comparison.
[5] Google/Alphabet — 2023–2024 disclosures on Google Cloud, TPU strategy, and investments in Anthropic; supports claims on distribution and compute economics.
[6] Axios — 2024 reporting on enterprise AI sticker shock and CIO budget pushback; informs pricing and adoption friction.
[7] PJM Interconnection — 2024 interconnection queue and long-term planning materials; quantifies grid and study backlogs relevant to AI load.
[8] Reuters — Reporting on U.S. transformer and switchgear shortages and utility interconnection delays; substantiates power and equipment bottlenecks.


Related update: We recently published an article that expands on this topic: read the latest post.

Related update: We recently published an article that expands on this topic: read the latest post.

Related update: We recently published an article that expands on this topic: read the latest post.

Related update: We recently published an article that expands on this topic: read the latest post.

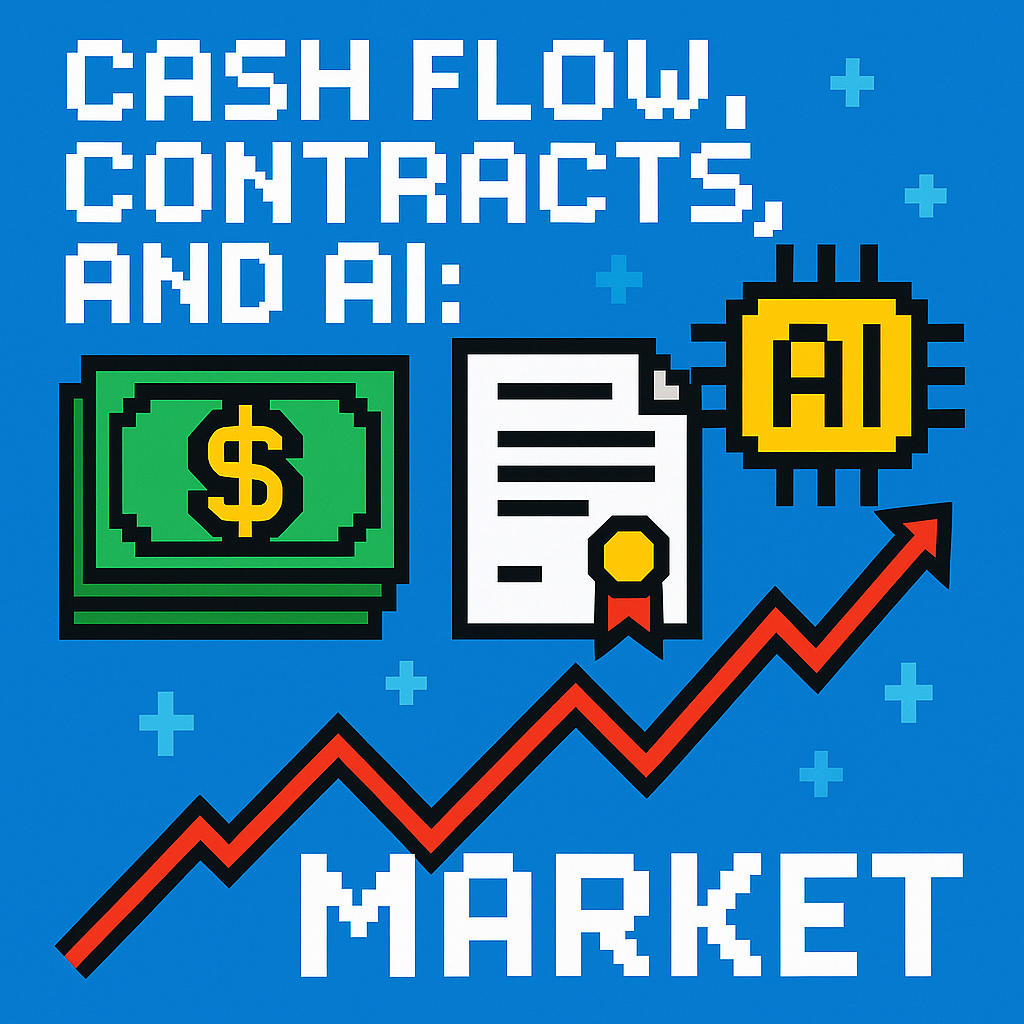
Cash Flow, Contracts, and AI: Market | Analysis by Brian Moineau

TL;DR

  • Apple, Amazon, Reddit, Micron, SK Hynix, and Roblox were the stocks that explained today’s market tape: AWS-driven optimism battled iPhone-margin angst, while AI memory suppliers traded like utilities-in-the-making and ad/social names paid a “Google tax.” [1][3][4][5]
  • The real tell: cash flow and contracts. Amazon’s AI push juiced AWS 37% YoY but flipped free cash flow negative; Micron locked in $22B of multi‑year take‑or‑pay deals, shifting memory from cyclical to contracted. [3][6]
  • Consumer platforms are now distribution‑fragile. Reddit’s post‑print wobble on search‑referral fears and Roblox’s spring guidance cut show what happens when Google changes the hose. Expect valuation dispersion to widen. [9][10]

What the source said

Barron’s grouped the day’s action around a handful of bellwethers—Apple, Amazon, Reddit, Micron, SK Hynix, and Roblox—to explain why U.S. stocks ended a bruising July on a mixed but improving note. It highlighted a tech rebound that still had to swim against Apple’s drop, while AI‑infrastructure names steadied sentiment. The framing was less about a single earnings print and more about how these companies’ moves mapped onto the market’s push‑pull between AI capex optimism and consumer tech skepticism. In short: Amazon and chips lifted; Apple weighed; social/ad names chopped. [1]

Why it matters

  • Stakeholders with the most to win or lose aren’t just the obvious shareholders. Hyperscalers (Amazon and peers), memory suppliers (Micron, SK Hynix), and their debt and equity financiers are tied together by multi‑year AI buildouts. A pause or re‑acceleration cascades instantly through contracts, capex plans, and margins. [3][6][7][8]
  • On the other side sit ad‑dependent consumer platforms (Reddit, Roblox) and even Apple’s hardware complex, whose fortunes hinge on distribution and unit economics. One algorithm tweak or one quarter of component inflation can erase a year’s worth of product work—or a quarter’s beat. [4][9][10]

Original analysis

The bifurcated tape behind “stocks that explain today’s market”

The tape split cleanly into two economies: AI infrastructure sellers (Amazon’s AWS and chip supply chain) and consumer‑facing platforms (Apple devices, Reddit/Roblox engagement). Infrastructure got validation; consumer names got questions.

  • AWS’s 37% YoY growth and Amazon’s disclosure that AI+chips are already a $25B annualized business tell you demand is real—but the bill is too. Amazon’s 12‑month free cash flow swung to a $7.6B outflow as it front‑loads capacity, which is why the stock can surge and still raise financing eyebrows. [3]
  • Memory suppliers have quietly derisked. Micron says customers have committed $22B via five‑year take‑or‑pay deals—language this industry simply didn’t use in past cycles. That’s a structural pivot from “price taker” to “capacity allocator.” [6]
  • Apple’s quarter was strong on the surface—$109.4B revenue, EPS $2.02, records across iPhone, Mac, and Services—but management also flagged rising memory costs into September. That pushes investors to ask: how much AI‑era component inflation can Services’ margin cushion offset? [4]
  • Social/UGC businesses are distribution‑fragile. Reddit’s results beat, but sentiment turned on search‑referral risk; publishers across the web are considering restricting Google access as AI Overviews cannibalize clicks. That’s not a one‑day story; it’s a potential structural CAC hike for the whole open‑web ad economy. [10]

Back‑of‑envelope calculations (two quick cuts)

  1. AWS AI+chips scale: If Amazon’s “AI+chips” sub‑business is running at a $25B annualized rate today and grows a conservative 35% in the next 12 months, that’s ~$33.8B by Q2 2027. At a 25% segment‑level operating margin, that implies >$8B of operating income from this sub‑line alone, enough to mask volatility elsewhere—but only if capex intensity tapers. [3]

Calculation: $25B × 1.35 ≈ $33.8B; $33.8B × 0.25 ≈ $8.45B.

  1. Memory contracts as earnings floor: Micron’s $22B of five‑year, take‑or‑pay commitments average ~$4.4B/yr of revenue visibility. At a 45% memory-cycle gross margin (illustrative), you’ve got ~$2.0B gross profit “pre‑sold” annually—even before spot upside. This is why memory beta has started to compress. [6]

Calculation: $22B ÷ 5 ≈ $4.4B; $4.4B × 0.45 ≈ $2.0B.

A 2×2 that actually predicts behavior

Axes: Demand visibility (high ↔ low) vs. Distribution risk (low ↔ high).

  • High visibility / Low distribution risk: Micron, SK Hynix (multi‑year supply deals; ADR broadened ownership). Playbook: raise capex methodically, pre‑sell capacity, manage price discipline. [6][7][8]
  • High visibility / High distribution risk: Amazon (visibility on AI demand via backlog; but customers can optimize consumption). Playbook: sprint now, prove ROI later; expect cash flow volatility. [3]
  • Low visibility / Low distribution risk: Apple (giant installed base; unit demand tied to macro and BOM inflation). Playbook: squeeze Services and ASPs to buffer input‑cost cycles; watch memory pricing. [4]
  • Low visibility / High distribution risk: Reddit, Roblox (ad or bookings funnels exposed to search and policy shifts). Playbook: reduce Google reliance via native search and direct acquisition; reprice ads toward logged‑in, high‑intent inventory. [9][10]

Contrarian read

Consensus: “The AI infrastructure trade is back—own hyperscalers and HBM suppliers; avoid ad‑driven platforms.” My pushback: the market is underpricing the permanence of memory supply contracts and overpricing the linearity of hyperscaler free cash flow. Take‑or‑pay deals make Micron/SK Hynix earnings more utility‑like than the market credits; in contrast, AWS’s stellar growth is already showing up as cash burn. That inversion—contracted suppliers vs. capex‑heavy buyers—means the traditionally “riskier” memory names could deliver steadier EPS beats than the buyers funding them over the next 12 months, even if AI demand stays hot. [3][6][7][8]

What others are missing

The step‑function change isn’t “AI demand up.” It’s contract structure and distribution power. On supply, five‑year take‑or‑pay agreements shift memory from a spot‑exposed commodity to booked capacity—de‑risking earnings through 2027 for Micron and, indirectly, for SK Hynix now that it can tap U.S. capital at scale via ADRs. On demand, open‑web distribution is being rewritten by AI Overviews. Reddit’s wobble is the forward case for any platform leaning on Google for new users: acquisition costs rise, and growth quality tilts to logged‑in, high‑intent cohorts. Coverage that stops at “big movers” misses how these two mechanics—contracts upstream, distribution downstream—will drive multiple expansion for suppliers and a valuation headwind for ad‑dependent platforms. [6][7][8][10]

What to watch next

  1. By Q4 2026, Micron lifts disclosed take‑or‑pay/backlog commitments to $30B+ across HBM/DRAM/NAND, confirming a structural derisking of memory earnings. [6]

  2. By Q2 2027, Amazon states AI+chips (within AWS and adjacent) at a >$35B annualized revenue run‑rate, even as TTM free cash flow remains below its 2025 level due to continued data‑center buildout. [3]

  3. By Q4 2026, Reddit reports flat to negative U.S. DAU YoY but >15% ex‑U.S. DAU growth and rising ad ARPU, reflecting a pivot toward logged‑in, high‑intent traffic as Google referrals dilute. [10]

My take

I’d rather underwrite contracted bandwidth than open‑web eyeballs in this tape. Memory just crossed a one‑way door: multi‑year commitments, ADR access for SK Hynix, and hyperscalers effectively pre‑paying for supply. That is not how the last memory super‑cycle ended. Meanwhile, every consumer platform that can be “answered” by AI will relearn the cost of rented distribution. I’m buying the derisked supplier earnings (Micron/SK Hynix on pullbacks) and treating AWS‑led rallies as proof of demand, not proof of cash discipline. For consumer internet, the burden of proof is now distribution resilience—not last quarter’s beat.

Sources

[1] Apple, Amazon, Reddit, Micron, SK Hynix, Roblox, and More Stocks That Explain Today’s Market — Barron’s (https://www.barrons.com/articles/stock-movers-e7d1ed18) — Sets the day’s framing: tech rebound vs. Apple drag;


Related update: We recently published an article that expands on this topic: read the latest post.


Related update: We recently published an article that expands on this topic: read the latest post.


Related update: We recently published an article that expands on this topic: read the latest post.

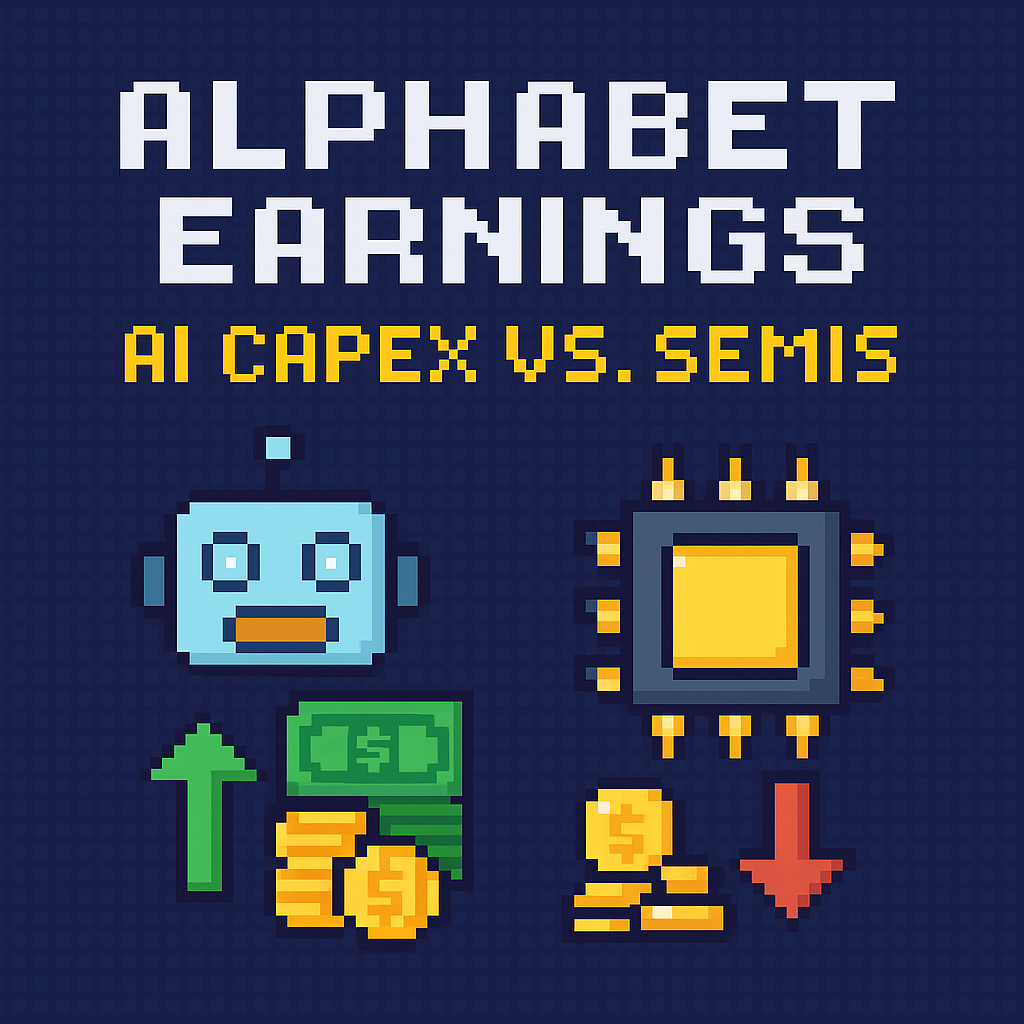
Alphabet Earnings: AI Capex vs. Semis | Analysis by Brian Moineau

TL;DR

  • Alphabet earnings are the market’s Rorschach test: a higher 2026 capex guide could either reignite the Magnificent Seven trade or finally force investors to price the cash‑flow hit that AI spending is already inflicting on hyperscalers like Alphabet, Microsoft, and Amazon. [1][4]
  • The semiconductor drawdown isn’t just “profit taking”; it’s a confidence wobble triggered by policy risk from the U.S. Commerce Department and competitive shocks like Moonshot’s Kimi K3, which sharpen questions about ROI on ever‑bigger AI data centers. [2][3][7]
  • My edge: Alphabet’s capex mix and disclosure will be the tell—if the language tilts toward in‑house accelerators and infrastructure ownership in 2026–2027, merchant semis won’t get the reflexive relief rally people expect. [4][5]

What the source said

Yahoo Finance frames Alphabet’s results as a “moment of truth” for tech investors weighing a revived Magnificent Seven trade versus “buying the dip” in semiconductors, citing a widening one‑month performance gap between the SOX and the MAGS cohort. The article quotes Evercore ISI’s view that hyperscalers’ forward free cash flow could turn negative this quarter, and it argues Alphabet’s print and 2026 capex outlook could either lift both groups or deepen the split. The piece flags export rules, tariff headlines, and China‑based model releases (Kimi K3, DeepSeek) as catalysts that stoke fears U.S. firms are overspending on AI. The advice: watch Alphabet’s 2026–2027 capex signal and the stock’s reaction on the day of the report. [1]

Why it matters

Two sets of investors are exposed right now. First, anyone who chased the AI hardware trade through SOX constituents is learning how policy whiplash (export controls, tariff noise) and model‑cycle surprises can compress multiples in a week. Reuters pegs the SOX down more than 11% from its June record as of mid‑July 2026; South Korea’s KOSPI, a chip‑heavy barometer, slid more than 20% from its late‑June peak into a bear market before episodic bargain‑hunting bounces. [2][6]

Second, Alphabet, Microsoft, Amazon, and Meta shareholders own the other side of the AI buildout: the capex and the cash flow. FactSet highlights that hyperscaler spending increasingly outruns internal cash generation, with rating agencies already punishing balance sheets (S&P cut Oracle to BBB‑ in July 2026, citing surging AI capex and negative FCF). Alphabet’s guidance cadence on 2026–2027 will indicate whether the runway is smooth or a funding gap still needs bridging, which matters for credit spreads and equity risk premia. [4]

Original analysis

Back‑of‑envelope: what Alphabet’s capex implies

  • Fact pattern: On its Q4 2025 call (Feb 4, 2026 transcript), Alphabet guided 2026 capex to $175–$185 billion, primarily for AI compute, technical infrastructure, and Cloud growth; management also flagged faster 2026 depreciation from prior ramps. [5]
  • Simple math: Use the $180B midpoint and assume a 5‑year straight‑line life for a blended basket of data centers, servers, and networking. Annual depreciation ≈ $180B ÷ 5 = $36B.
  • Cash consequence: To offset $36B of incremental non‑cash expense and its downstream cash costs (power, ops), Alphabet would need incremental operating cash flow of roughly the same order. At a 30% operating margin (Alphabet reported ~30% in Q4 2025), that implies ~$36B ÷ 0.30 ≈ $120B of additional annual revenue over a steady‑state base to hold FCF flat—directional, but scale‑setting. [5]
  • Why this matters: Even if the real mix and useful lives differ, the size signals that one or more quarters of pressured or even negative free cash flow is plausible as assets ramp, a dynamic credit markets and rating agencies are already sensitized to across the hyperscaler set. [4][7]

2×2: “Capex Trajectory” × “Model Edge”

  • Axes

    • X: Capex trajectory in 2026–2027 (raising vs. pausing) as implied by Alphabet’s guide and commentary. [5]
    • Y: Model edge in 2026 (frontier differentiation rising vs. compressing) amid Kimi K3 and DeepSeek pressure on capability‑per‑dollar. [3][1]
  • Quadrants

    • Flywheel (Raising × Rising): Alphabet guides up and demonstrates widening AI product monetization in Search and Cloud, with explicit attach metrics or pricing anecdotes. This pulls MAGS higher; merchant‑semi relief is muted unless Alphabet signals more third‑party silicon procurement.
    • Cash‑burn trap (Raising × Compressing): Guidance up, but external shocks (e.g., Kimi K3 narrowing capability/cost gaps) keep monetization lagging; market punishes semis and hyperscalers, and spreads widen for issuers tapping debt to fund AI builds. [3][4]
    • Wait‑and‑see (Pausing × Rising): Capex restraint plus visible product velocity favors MAGS; SOX stabilizes but trails as investors rotate to software yield over hardware volume.
    • Value rotation (Pausing × Compressing): Both trades suffer; capital chases power, grid, cooling, and memory vendors with nearer‑term pricing power such as Vertiv, Schneider Electric, SK hynix, and Micron Technology.

My base case for the print: Alphabet’s language will keep capex elevated and emphasize infrastructure ownership across data centers, networking, and power integration. That stance is bullish for Alphabet’s moat and for select suppliers like HBM memory and advanced packaging, but it’s not a “lift all semis” catalyst—especially with BIS export‑policy noise resurfacing in Washington and investors newly alert to the cash cost of AI. [4][7]

What others are missing

Coverage obsesses over A100s vs. TPUs and the SOX chart, while the overlooked variable is competitive efficiency: open‑weight models like Moonshot’s Kimi K3 narrow capability gaps at lower API prices and push buyers toward “good‑enough” inference. If good‑enough AI improves faster than customers’ willingness to pay in 2026, ROI thresholds on hyperscaler‑owned capacity ratchet higher, and utilization needs to run hotter before expansions pencil. That dynamic hits merchant compute volumes first (customers sweat assets longer) and compresses the window for hyperscalers to translate capex into sticky revenue. Nature’s reporting that Kimi K3’s launch swamped capacity and narrowed the U.S.–China performance gap frames this as an industry‑wide pricing and payback story, not just a China headline. [3]

What to watch next

  1. By October 31, 2026, Alphabet’s FY2026 capex midpoint will remain at or above $180B, with FY2027 qualitatively guided “higher” again in prepared remarks or Q&A (transcripts/IR pages will make this falsifiable). [5]
  2. By January 15, 2027, the U.S. Commerce Department will publish at least one new tightening step or formal clarification that restricts AI‑chip shipments to Chinese firms or their overseas subsidiaries (Federal Register, BIS notices, or congressional testimony). [7]
  3. By December 31, 2026, the KOSPI will have rallied at least 10% from its July 8, 2026 close of 7,246.79 as retail “buy‑the‑dip” flows and chip export strength intermittently counter AI‑spending angst (index data checkable). [6]

My take

Alphabet earnings are the fulcrum for the AI trade, but not because a bigger 2026 capex number rescues semis. If management doubles down on owning the stack, I’d stay overweight Alphabet and be selective in semis: HBM suppliers and advanced packaging ride the build; merchant compute faces share risk where TPUs or custom silicon take wallet. The SOX can bounce on positioning, but sustained upside likely waits for either a clearer monetization arc at the hyperscalers or policy relief from Washington and Brussels. Until then, favor the cash engines that control their own destiny—and make everyone else pay to plug in. [4][5]

Sources

[1] Alphabet earnings offer a moment of truth in this tech stock battle — Yahoo Finance (https://finance.yahoo.com/technology/article/alphabet-earnings-offer-a-moment-of-truth-in-this-tech-stock-battle-121514421.html) — Frames the “moment of truth,” the MAGS vs. SOX divergence, and Evercore ISI’s FCF warning.

[2] Chip stocks hit rocky patch. What’s next? — Reuters via Investing.com (https://www.investing.com/news/economy-news/chip-stocks-hit-rocky-patch-whats-next-4787795) — Documents the July semiconductor selloff and cites the SOX down >11% from its June record.

[3] Does China’s latest AI model finally equal US rivals? What scientists think — Nature (https://www.nature.com/articles/d41586-026-02281-2) — Reports on Moonshot’s Kimi K3 launch, demand spikes, and the narrowing performance gap.

[4] Hyperscalers Tap External Financing as AI Capex Outruns Cash Flow — FactSet Insight (https://insight.factset.com/hyperscalers-tap-external-financing-as-ai-capex-outruns-cash-flow) — Explains the financing strain; notes S&P’s Oracle downgrade tied to surging capex and negative FCF.

[5] Alphabet (GOOGL) Q4 2025 Earnings Call Transcript — The Motley Fool (https://www.fool.com/earnings/call-transcripts/2026/02/04/alphabet-googl-q4-2025-earnings-call-transcript/) — Provides Alphabet’s 2026 capex guide ($175–$185B) and commentary on depreciation and AI infrastructure priorities.

[6] South Korea’s KOSPI drops 20% from June record close as chipmakers drag — Reuters via MarketScreener (https://www.marketscreener.com/news/south-korea-s-kospi-drops-20-from-june-record-close-as-chipmakers-drag-ce7f5ed8de8ef522) — Establishes the KOSPI’s bear‑market move and chip‑led volatility shaping “buy‑the‑dip” episodes.

[7] Regulatory action on chips, AI is coming, Commerce official says — Reuters via MarketScreener (https://www.marketscreener.com/news/regulatory-action-on-chips-ai-is-coming-commerce-official-says-ce7f5edddb8bf121) — Signals pending U.S. export‑control actions on AI chips, a key variable for hyperscalers and semis.


Related update: We recently published an article that expands on this topic: read the latest post.

Chips Rally Fuels Market Rebound | Analysis by Brian Moineau

TL;DR

  • Chips led a rebound from the Fed-led sell-off as semiconductors ripped and the Nasdaq rose 1.91%, while the S&P 500 gained 1.08% on June 18, 2026; energy lagged as WTI crude slid to $73.58 on reports of a U.S.–Iran détente. [1][4]
  • Breadth improved under the surface: the Russell 2000 outperformed with nearly a 2% gain, while defensives wobbled—classic risk-on when oil and rate fears cool together in New York trading. [1][2]
  • The tape says “AI back on,” but the investable takeaway is rotation: lower crude compresses energy earnings while easing input and financing costs for power-hungry data center suppliers and small-cap borrowers in the U.S. market. [1][3][4]

What the source said

CNBC’s live blog logged a broad rebound after the Fed-driven slump: the S&P 500 closed up 1.08% to 7,500.58, the Nasdaq rose 1.91% to 26,517.93, and the Dow added 0.14% to 51,564.70 on June 18, 2026. Semiconductors led; Intel drew positive chatter linked to Apple, and AI-adjacent names such as Corning jumped 7%. The Russell 2000 outperformed with nearly +2% on the day, while the S&P energy sector fell almost 2% as WTI dipped to $73.58 on U.S.–Iran agreement headlines. Individual movers included Enphase (+10%), Corning (+7%), and Exxon/Chevron (−2%+), while Kroger slipped after a one‑cent EPS miss despite a revenue beat. [1]

Why it matters

Two policy levers—rates and oil—just loosened their grip on risk assets after a midweek hawkish Fed tone and a Thursday oil slide to the low‑$70s per barrel, as reported by Axios and Reuters from Washington and Tehran angles. If crude holds near $73–$76 through August 2026, gasoline and freight costs ease, trimming the inflation impulse that pressured multiples in Q2. In that setup, equity buyers can re-risk into growth stories (chips/data centers) without fighting duration headwinds. [2][3][4]

Small-cap industrials and services tied to diesel and short-term borrowing—think Russell 2000 constituents in trucking, tools, and regional services—gain operating and financing relief when oil dips and yields stabilize into Q2 2026 quarter‑end. Conversely, energy producers face a valuation headwind as futures reprice supply risk lower on a U.S.–Iran thaw around the Strait of Hormuz. Active managers entering June 2026 month‑end must choose between chasing AI beta or leaning into a breadth turn that favors cyclicals and balance‑sheet repair. [1][2][4]

Original analysis

Contrarian read: June 18, 2026 looked more like rotation than a pure AI melt-up in New York.

  • Consensus: “The AI trade is back—buy chips because the Fed sell-off was a blip.” The CNBC live blog framed the day that way while the Fed’s June messaging lingered. [1][6]
  • My case: Semis ripped, but the simultaneous pop in the Russell 2000 and slump in energy are cleaner breadth tells than another megacap surge. After a chip “bloodbath” earlier in June, next‑day rebounds often fade unless credit and input costs improve together; WTI at $73–$74 plus a Friday Juneteenth holiday that curbs catalysts tilts flows toward cyclicals over narrow AI leaders. [1][2][4][6]

Back‑of‑envelope calculation: Kroger’s miss was optical, not fundamental, in Q1 FY2026.

  • KR printed $1.58 in Q1 EPS vs. $1.59 expected—a $0.01 shortfall, or ~0.63% below consensus (0.01/1.59). Revenue was $46.12B vs. $45.59B, a $0.53B beat—about 1.16% above expectations (0.53/45.59). A 7% intraday drawdown on a one‑cent EPS miss—even as revenue outperformed—implies punishment for guidance quality or margin mix, not headline growth, and sets up mean reversion if fuel and promo costs moderate into H2 2026. [1][5]

Named‑stakeholder breakdown: the week’s winners and losers map to oil and AI.

  • Intel (INTC): Re‑rating risk tilts positive near term. A “brand upgrade” narrative tied to Apple chatter and a broad semi bounce catalyzed gains; sustained upside needs data center share wins, not just headlines. Tactically constructive into June month‑end while SOX momentum runs. [1][3]
  • Apple (AAPL): Bank of America nudged FY26E EPS to $8.63 as pricing offsets memory tightness; a $100 Pro/Pro Max hike is the tell. Risk: elasticity in a stretched replacement cycle for premium iPhones in the U.S. and China. [1]
  • Enphase (ENPH): IQ9S microinverter traction plus a Barclays upgrade produced a 10% jump; if oil stays soft and residential paybacks stabilize in H2 2026, backlog conversion can carry shares. [1]
  • Exxon/Chevron/Occidental: Oil’s downdraft—linked to U.S.–Iran détente talk and Hormuz passage risk easing—compresses near‑term cash yields and de‑rates beta. Discipline on 2026 capex versus buybacks will decide multiple support. [1][3][4]
  • Corning (GLW): A stealth AI beneficiary via glass, optics, and fiber; a 7% pop signals the market’s hunt for second‑order suppliers with real EBITDA tied to data center builds in places like Arizona and Ohio. [1]

Historical analogue: 2013’s mini “taper tantrum” flipped once rates found a level, and small caps plus cyclicals staged a summer catch‑up while energy lagged on supply comfort; 2026’s hawkish Fed tone followed by a breadthy risk‑on day with softer crude rhymes with that script. [2][4][6]

2×2: Who wins if chips lead while WTI stays below $80 into Q3 2026? [4]

  • High energy use + AI adjacency (cooling, power, optics suppliers): Win big—margin tailwinds and top‑line growth.
  • High energy use + no AI tie (airlines, trucking): Win moderate—cost relief without multiple expansion.
  • Low energy use + AI adjacency (software): Mixed—sentiment help, limited operating leverage.
  • Energy producers (upstream, oil‑beta): Lose near term—lower realized prices and weaker narrative carry.

Net: Thursday’s bounce is more than chips; it’s a breadth tell powered by cheaper oil and “good enough” macro into late June 2026. Position sizing should reflect that—add to cyclicals and small caps with operating leverage to sub‑$80 WTI, keep AI but prefer second‑order suppliers over crowded leaders. [1][2][4]

What others are missing

Coverage fixates on index points and AI tickers, but the oil‑tape linkage—with the Strait of Hormuz explicitly in play via a U.S.–Iran ceasefire framework—carries second‑order consequences for June–July CPI prints in the United States. That supply relief pushes WTI toward the mid‑$70s, compresses energy earnings, and boosts P&Ls for energy‑intensive end markets like glass, optics, cooling, and logistics tied to U.S. data centers. If crude sticks near $73–$76 instead of $85, multiples expand more for small caps and capital goods than for an already‑prized AI complex. Watch oil first; it’s the breadth key. [2][3][4]

What to watch next

  1. By August 15, 2026, WTI crude trades below $70 intraday at least once as supply risk premia fade on further clarity around the U.S.–Iran framework. [4]

  2. Between June 24 and September 30, 2026, the Russell 2000 outperforms the S&P 500 by at least 300 bps, reflecting falling fuel costs and improving breadth in U.S. equities. [1][2]

  3. By Q3 2026 earnings season (reported October–November 2026), at least two of Exxon, Chevron, or Occidental guide capex lower or slow buybacks versus H1 2026 cadence, acknowledging weaker realized prices. [1][4]

My take

Chasing semis after a big green day is easy; leaning into energy‑sensitive cyclicals and quality small caps while WTI sits at $73.58 is harder but smarter for Q3 risk. I’ll keep core AI exposure, but I’ll add to second‑order suppliers (glass, optics, cooling) and borrowers with high operating leverage to cheaper fuel. If a credible U.S.–Iran détente holds and crude drifts to the low‑$70s, the next leg won’t be five tickers—it’ll be 500 across the Russell 2000 and U.S. cyclicals. I’m buying the rotation, not the headline, with a 2026 lens on breadth. [1][2][4]

Sources

  1. S&P 500 closes higher, Nasdaq climbs nearly 2% as chips fuel comeback from Fed sell-off: Live updates — CNBC (https://www.cnbc.com/2026/06/17/stock-market-today-live-updates.html) — Primary live blog with index closes, sector moves, and notable stock drivers including energy weakness and small-cap strength.

  2. How major US stock indexes fared Thursday 6/18/2026 — AP News (https://apnews.com/article/411ec68891aa5dc7d7f684e0305e2aa3) — Confirms the broad rebound, notes calendar effects around Juneteenth, and frames weekly context.

  3. Wall St advances as Iran deal optimism offsets hawkish Fed; Intel soars — Reuters via Investing.com (https://au.investing.com/news/economy-news/wall-st-futures-bounce-back-as-usiran-deal-optimism-balances-hawkish-fed-intel-up-4494347) — Corroborates semiconductor leadership and market balancing of Fed messaging with geopolitical tailwinds.

  4. Oil prices sink on announcement of Iran deal — Axios (https://www.axios.com/2026/06/14/oil-prices-us-iran-war-hormuz-strait-peace-deal) — Details on the U.S.–Iran agreement, Strait of Hormuz implications, and the associated drop in WTI.

  5. Kroger (KR) Q1 Earnings Miss Estimates — Zacks (https://www.zacks.com/stock/news/2939171/kroger-kr-q1-earnings-miss-estimates) — Confirms the $1.58 EPS vs. $1.59 consensus and revenue outperformance, enabling the calculation.

  6. June Fed Meeting: Updates and Commentary — Kiplinger (https://www.kiplinger.com/news/live/fed-meeting-updates-and-commentary-june-2026) — Documents the midweek Fed‑led sell‑off and rate tone that set up the rebound dynamic.


Related update: We recently published an article that expands on this topic: read the latest post.

AI Surge Sparks Power Grid Investment | Analysis by Brian Moineau

Power stocks with AI tailwinds: why Goldman Sachs says the grid matters now

Goldman Sachs flags power infrastructure stocks poised to benefit from AI-driven demand and geopolitics — and that sentence should make investors sit up. The wave of AI capex is no longer just about chips and cloud software; it’s reshaping where and how electricity is produced, transmitted, and stored. If you follow markets, the idea that power companies are suddenly “AI plays” sounds odd — but the underlying math is simple: models need power, racks need cooling, and hyperscalers are spending at scale.

What Goldman Sachs is seeing and why it matters

Goldman’s research maps a fast-growing disconnect between compute demand and existing power infrastructure. Their analysis estimates large increases in data center power use and projects surging capital expenditures by hyperscalers to build AI-ready facilities and connect them to reliable supply. That translates into three concrete investment vectors:

  • Higher demand for generation capacity and dispatchable resources (gas, hydrogen-ready plants, and accelerated renewables plus firming).
  • Grid upgrades: transmission lines, substations, and interconnect capacity to move large blocks of power to hyperscale campuses.
  • Flexibility and reliability solutions: battery storage, microgrids, and resilience services sold to data centers and industrial consumers.

These are not abstract ideas. Goldman and others forecast data center power demand growing materially over the next several years, forcing utilities and independent power providers to respond — and creating revenue opportunities for companies that build or enable that infrastructure. (goldmansachs.com)

Geo-politics and the energy angle

Geopolitics complicates — and amplifies — the thesis. Countries and hyperscalers are wary of relying on single-region supply chains or fragile grids. That has two effects:

  • Onshoring and regional diversification of data centers, which boosts demand for local generation and transmission investment.
  • Strategic stockpiles and long-term contracts for firm power, which favor utilities and project developers that can deliver scale and contractual reliability.

In places where grid constraints or permitting slow projects, premium pricing and green-reliability solutions become possible. Goldman explicitly links national energy security concerns and the AI race: countries that secure power for AI hardware gain a strategic edge, and investors notice where that spending is likely to land. (finance.yahoo.com)

Winners and the kinds of stocks to watch

Not every company that touches “power” will benefit equally. The most direct beneficiaries tend to fall into a few categories:

  • Large utilities and transmission builders with permitting know-how and deep balance sheets.
  • Independent power producers and developers that can supply fast-build generation or long-term contracts.
  • Energy storage and grid-software firms that unlock capacity, enable demand response, or provide resiliency to hyperscalers.
  • Specialist contractors and equipment makers that build substations, switchgear, and data-center-adjacent microgrids.

Expect sector dispersion: some regulated utilities may see steady, regulated returns from interconnection work; merchant developers might capture outsized upside via long-term AI contracts. Goldman’s work highlights that investors should look past simple “data center” tickers and toward the power chain that supplies those facilities. (goldmansachs.com)

Risk checklist before you chase the trade

This isn’t a free lunch. Several risks can blunt the upside for “power stocks with AI tailwinds”:

  • Efficiency and architectural advances. If chip and system-level improvements reduce power per unit of compute faster than expected, demand could moderate.
  • Permitting and timeline risk. Transmission and large generation projects face long lead times and political pushback.
  • Commodity exposure. Some developers rely on natural gas prices or supply chains that can be volatile.
  • Crowd and valuation risk. The story has drawn attention; some stocks already price in a lot of future AI-driven revenue.

Assess whether a company’s near-term cash flows and balance sheet can survive potential delays. Tailwinds matter — but execution and timing matter more for shareholder returns.

Signals to monitor going forward

If you want to track whether this theme is real and sustainable, watch for these signals:

  • Announcements of hyperscaler long-term power purchase agreements (PPAs) or dedicated off-take deals.
  • Regulatory filings and interconnection queue moves that indicate transmission commitments.
  • Utility capex plans that explicitly add AI/data-center load or resilience programs.
  • Changes in grid stress metrics (peak occupancy rates, curtailments, connection backlogs).

These indicators separate PR headlines from committed, real-world spending. Goldman’s modeling also points to occupancy and utilization rates in data centers as a revealing metric — if occupancy stays near peak, structural power demand is more likely to persist. (goldmansachs.com)

Power stocks with AI tailwinds: a practical investor stance

If you’re building exposure, consider a thoughtful mix rather than one concentrated bet:

  • Core utility exposure for regulated, defensive income and steady capex recovery.
  • A satellite allocation to developers and storage specialists that can outperform on execution.
  • Avoid overpaying for momentum names that already assume the full narrative.

Rebalance toward companies with proven project pipelines, strong relationships with hyperscalers, or niche technologies that reduce integration risk. Time horizons matter — this is a multi-year structural story, not a lightning trade.

My take

The AI buzz has shifted the investment map. What began as a race for semiconductors and talent is morphing into an infrastructure buildout where electrons matter as much as exabytes. Goldman’s emphasis on power infrastructure is a useful reminder: durable secular themes often hide in pipes, wires, and contracts. For investors, the interesting opportunities are those that combine policy-facing scale, operational execution, and long-term contracted cash flows. Those are the companies most likely to convert AI demand into real returns. (goldmansachs.com)

Sources