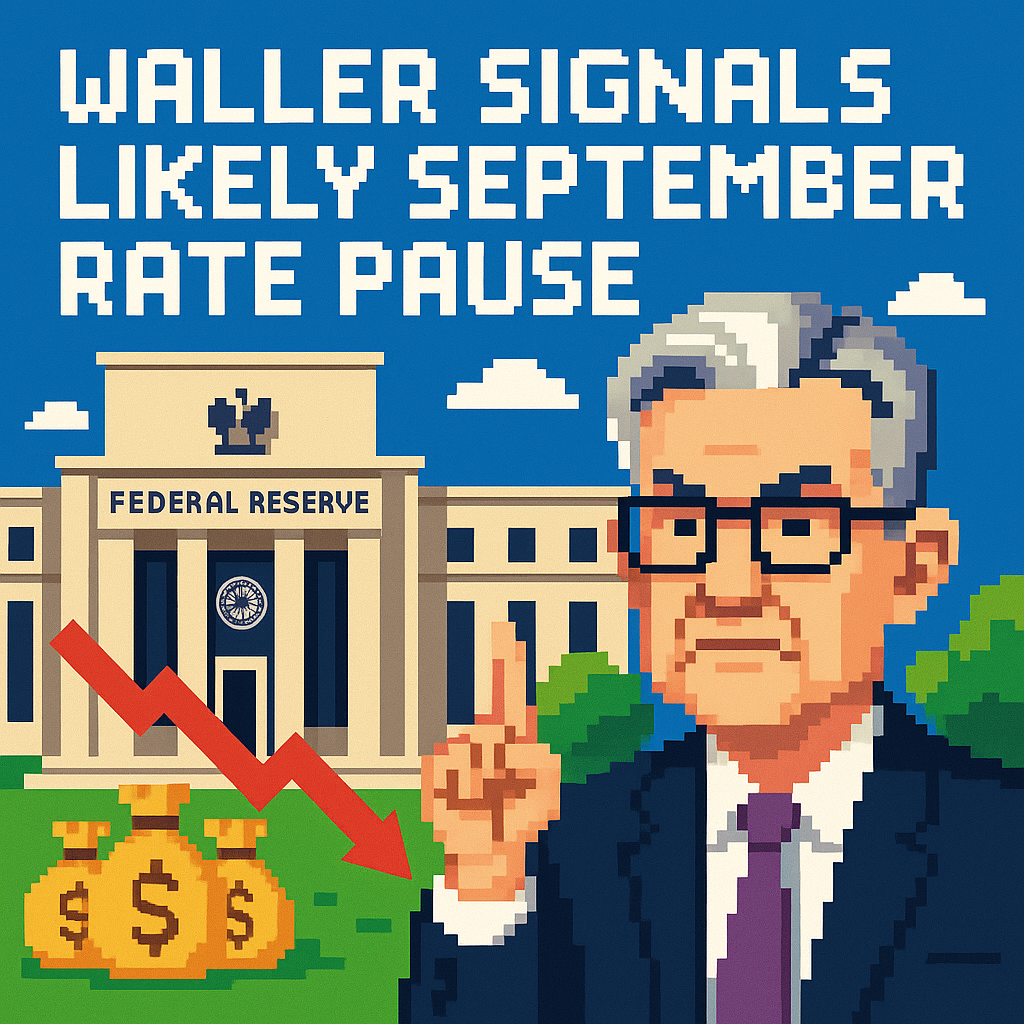
Waller Signals Likely September Rate Pause | Analysis by Brian Moineau

TL;DR

  • Federal Reserve Governor Christopher Waller said he was inclined to hold rates at the mid-September 2026 FOMC if August inflation cools, countering Kevin Warsh’s hawkish Jackson Hole tone that pushed markets toward a September hike. [1][3]
  • CME-linked odds for a September increase jumped near 58% after Warsh’s Jackson Hole remarks, then drifted back toward roughly 50% after Waller’s comments. [3][2]
  • My read: data-dependent voices like Waller will carry the month unless core inflation re-accelerates materially in the next print; markets look a bit rich on hike odds here. [1][2]

What the source said

The Financial Times reported that Governor Waller indicated he was inclined to keep the federal funds rate unchanged in September 2026 if incoming August inflation data confirm cooling, and it contrasted that signal with markets’ post–Jackson Hole shift toward a hike. [1]
Coverage noted that Warsh’s hawkish posture in Jackson Hole, Wyoming, on August 28, 2026, helped push hike odds higher before Waller’s remarks pared them. [3]
Waller explicitly grounded his September stance in the next CPI/PCE readings and acknowledged softer labor data, with July’s U.S. unemployment rate near 4.1%. [2]
Net: the FT framed an active policy debate—Warsh’s toughness nudged probabilities up; Waller’s conditional patience leaned them back toward a hold pending next week’s inflation report. [1]

Why it matters

A 25 basis point hike or hold in September 2026 changes mortgage quotes, corporate funding costs, and bank hedging right now, not in theory. The split between Warsh’s tougher stance and Waller’s data-first posture pulls the Treasury curve, which feeds into housing affordability, small‑business credit, and capex decisions in cities like Dallas and Detroit. [2][3]
Pricing moves of a few basis points affect real money: dealers, asset managers, and regional lenders must adjust risk on the fly when odds swing 8–10 percentage points in a single session. [2][3]

Investors also have to parse a communications shift after Jackson Hole. Warsh downplayed forward guidance and emphasized discipline, which increases the premium on each CPI and PCE print. [3]
That stance amplifies the influence of officials like Waller who translate data into conditional policy, and it heightens whiplash risk as traders chase each speech, tightening financial conditions via volatility even without a formal hike. [1][3]

Original analysis

Contrarian read — the consensus and why I disagree

  • Consensus: Warsh’s Jackson Hole hawkishness tipped the odds toward a September hike, with CME-linked probabilities near 57–58% intraday. [3]
  • My case: Waller supplied the data-contingent anchor and odds slid back toward even-money after his remarks; if August core CPI runs ~0.20–0.25% m/m, a voting majority will back a hold over a preemptive hike. [1][2]
  • Labor adds cover: with July unemployment around 4.1% and signs of easing job openings, a “watchful hold” minimizes regret while keeping optionality. [2]

Back-of-envelope calculation — how much “hike risk” is actually priced

  • After Jackson Hole: implied odds of a 25 bp September hike ≈ 58%; expected move = 0.58 × 25 bp ≈ 14.5 bp. [3]
  • After Waller’s pushback: pricing cooled to ≈ 50%; expected move = 0.50 × 25 bp = 12.5 bp. [2]
  • Delta ≈ 2 bp; with a two‑year Treasury duration ~1.9, price impact ≈ 1.9 × 0.0002 = 0.00038, or 0.038%. On a $250,000,000 position, mark‑to‑market ≈ $95,000 (author’s calculation using duration × yield change).

Back-of-envelope calculation — the household translation

  • Assume a $400,000, 30‑year fixed mortgage priced at 7.00% if the Fed holds versus 7.25% if it hikes 25 bp.
  • Payment at 7.00%: r = 0.07/12; n = 360 → about $2,663/month.
  • Payment at 7.25%: r = 0.0725/12; n = 360 → about $2,729/month.
  • Difference ≈ $66/month, or ~$800/year—material for first‑time buyers deciding whether to lock in September 2026 (author’s calculation).

Named‑stakeholder breakdown — what this means right now

  • Homebuilders (D.R. Horton, Lennar): A September hold steadies rate locks into the autumn selling season; a hike risks cancellations and heavier incentives. Watch MBA weekly applications and order backlogs in Q3.
  • Regional banks (PNC, Fifth Third): A hold stabilizes deposit betas; a hike nudges NIM but worsens AFS/HTM marks, pressuring tangible common equity optics into Q4.
  • AI‑buildout supply chain (Nvidia, Broadcom, Eaton): Warsh linked late‑cycle demand risks to frothy investment; a hike cools multiples and debt‑financed data‑center capex, while a hold stretches the runway for 2027–2028 plans. [3]
  • Utilities and yield proxies (NextEra, Duke): Even a 2–3 bp shift in expected policy bleeds into equity risk premia; a hold supports defensives that sold off when hike odds spiked. [2][3]
  • High‑yield issuers (private credit funds; B‑rated borrowers): A hold preserves refinancing windows into Q4 2026; a hike raises coupons into clustered maturities.

Historical analogue — how guidance risk feeds term premia

  • In 2013’s “taper tantrum,” less‑predictable guidance widened term premia even as the expected policy path shifted modestly; the 10‑year yield rose over 100 bp from May to September 2013 while the funds rate stayed pinned.
  • In 2017, the Fed’s balance‑sheet normalization plan muted that volatility by pre‑announcing caps; today’s retreat from specificity rhymes more with 2013 than 2017, arguing for a fatter term premium into 2026–2027.

A simple typology for the Fed’s current split

  • Pragmatic data‑first (Waller): Votes hinge on the next CPI/PCE; communicates thresholds like “if continued progress, hold.” [1][2]
  • Credibility‑first (Warsh): Emphasizes vigilance on inflation and accepts more market volatility as the cost of policy flexibility. [3]
  • Markets ping‑pong between these poles, which is why odds lurched to ~58% post–Jackson Hole, then cooled toward ~50% after Waller. Position sizing should reflect that tug‑of‑war rather than a single static reaction function. [3][2]

What others are missing

Most coverage fixates on the September 2026 binary. The bigger story is how Warsh’s retreat from forward guidance changes the entire term structure by design, raising communication uncertainty that feeds the term premium even if the modal path for the funds rate barely shifts. [3]
Waller’s conditional clarity briefly filled that vacuum, but the structural takeaway is fewer breadcrumbs and fatter premia, which matter for 10‑year mortgages, 20‑ to 30‑year project finance, and multi‑decade utility rate cases that discount far‑out cash flows. [1][3]
Even if the FOMC holds on September 16, a higher term premium can keep borrowing costs elevated and price‑to‑earnings multiples subdued into 2027, especially in capital‑intensive sectors.

What to watch next

  1. By September 13, 2026: Core CPI prints at or below 0.25% m/m SA; if that happens, September hike odds fall below 40% by the September 14 open.
  2. By September 16, 2026: FOMC holds the target range; the statement adds a data‑contingent “willingness to act” clause without new forward guidance.
  3. By October 31, 2026: The two‑year Treasury yield stays within ±15 bp of its September 9 close, signaling a narrow realized policy path despite noisier Fed rhetoric.

My take

I side with Waller’s conditional hold. Banking disinflation progress while unemployment hovers near 4.1% reduces overshoot risk and buys time to see whether shelter and non‑market services cool into Q4 2026. [2]
Warsh’s concern about credibility is understandable, but a preemptive hike into moderating core could tighten more than intended, especially with AI‑linked capex muddling relative prices. If August core lands near 0.20–0.25% m/m, expect a steady hand and a statement that keeps the hawkish umbrella open—but furled. [1][2]

Sources

  1. Financial Times — “Fed’s Chris Waller inclined to hold rates if inflation cools” (September 2026). What this contributes: primary report on Waller’s conditional hold stance and its timing.
  2. AP News — Coverage of Waller’s remarks and market reaction (September 2026). What this contributes: odds near 50%, July unemployment near 4.1%, and context on shifting expectations.
  3. Kiplinger — “Stocks turn down as Warsh talks up rates: Stock Market Today” (late August 2026). What this contributes: link between Warsh’s Jackson Hole tone and CME FedWatch odds around 57–58%.

Nob Hill Opulence: Patty Hearst’s | Analysis by Brian Moineau

TL;DR

  • A $5.2M San Francisco condo at 1001 California Street, No. 7—Patty Hearst’s post‑bail perch—just hit the market with a 2,980‑sq‑ft, full‑floor plan in a 1914 Houghton Sawyer Beaux‑Arts building on Nob Hill. [1]
  • The premium is explicit: ~$1,745/sq ft here vs. ~ $1,300/sq ft in Nob Hill and ~ $1,090 citywide, roughly +34% and +60% respectively. Scarcity and provenance still price in. [1][6][5]
  • Carrying costs bite: with 20% down and a jumbo ~6.78% (Aug 24, 2026), plus $5,432 HOA and a 1.18268325% property tax rate, the all‑in before insurance lands near $37.6K/month—pushing buyers toward all‑cash or rate‑insensitive profiles. [4][2][3]

What the source said

SFGATE profiles 1001 California St., No. 7, a full‑floor, 2,980‑sq‑ft penthouse in a 1914 Houghton Sawyer Beaux‑Arts building on Nob Hill, listed at $5.2 million with Sotheby’s agents Mary Lou Castellanos and Grazia Bennett. The article notes the arched stained‑glass skylight, paneled library, formal dining room, marble hearth, and a terrace off the primary suite, plus proximity to the Fairmont Hotel and Huntington Park on California Street. The story highlights that Patty Hearst lived here with her parents in the 1970s after release on bail, and that the unit last sold for $3.5 million in 2010. The listing shows HOA dues of $5,432/month and parking as “on site – monthly fee,” not deeded. [1][2]

What others are missing

  • Transfer tax changes the net math: San Francisco imposes 2.25% Real Property Transfer Tax on $5M–$10M deals, which is about $117,000 on $5.2M; sellers usually pay in SF custom, but buyers sometimes negotiate splits in thin markets. [8]
  • Non‑deeded parking is a variable OPEX line, not an asset: Nob Hill garages around California Street list monthly rates in the ~$400–$650 range in 2026, and operators can raise rates annually. [2][10]
  • Federal tax caps dull the “write‑off” story: the TCJA’s $750,000 mortgage interest cap (2017) and the $10,000 SALT cap mean a financed buyer with a ~$4.16M jumbo deducts only a fraction of first‑year interest; the rest is fully out‑of‑pocket. [9]

Why it matters

The buyer pool here is a narrow slice: households indifferent to a ~6.78% jumbo, willing to absorb $5,432 monthly HOA dues, and prioritizing 1914 Beaux‑Arts fabric and Nob Hill cachet over 2015‑era tower amenities at Lumina or 2008‑era One Rincon Hill. That cohort exists but is smaller than the 2010s South Beach/SoMa set. [2][4]

On the sell side, the HOA at 1001 California and the Sotheby’s team are testing whether Hearst‑era lore and a full‑floor plan can clear at $5.2M while citywide condo metrics still reset. If it trades near ask, it affirms that a handful of pedigreed addresses sit above the broader San Francisco condo baseline; if it lingers, it underlines how financing costs and dues now gate even blue‑chip corners opposite the Fairmont. [1][5][6]

Original analysis

Back‑of‑envelope: all‑in monthly for a financed buyer

  • Assumptions: 20% down on $5.2M → $1.04M down; $4.16M loan; jumbo 30‑year fixed ≈ 6.78% (Aug 24, 2026); SF FY25–26 property tax rate 1.18268325%; HOA $5,432/month. [4][3][2]
  • Mortgage P&I: r = 0.0678/12; n = 360; P&I = 4,160,000 × [r(1+r)^n]/[(1+r)^n − 1] ≈ $27,065/month (calculator cross‑check). [7]
  • Property tax: $5,200,000 × 1.18268325% ÷ 12 ≈ $5,125/month. [3]
  • HOA: $5,432/month. [2]
  • Total before insurance/utilities: ≈ $27,065 + $5,125 + $5,432 = ~$37,622/month. [2][3][4][7]

What that premium buys

  • Price per square foot: $5,200,000 ÷ 2,980 ≈ $1,745/sq ft. [1]
  • Benchmarks: Nob Hill median ≈ $1,300/sq ft; citywide ≈ $1,090/sq ft; premium ≈ +34% vs. Nob Hill and ≈ +60% vs. citywide. [6][5]

Contrarian read

  • Consensus: “Trophy prewar Nob Hill is insulated; these always move.”
  • Counter: Two frictions cap velocity. First, the ~$37.6K/month pre‑insurance nut filters to cash or very low‑LTV buyers. Second, dues‑heavy historic full‑service stock competes with 2014–2016 amenity towers (valet, gyms, pools) offering similar all‑in monthlies on smaller footprints, often with deeded parking; here, parking is “on site – monthly fee,” not deeded. [2][4][5][6]

2×2: The SF luxury‑condo buyer matrix

  • Axes: A) Fabric (Historic character ←→ Contemporary spec) and B) Operating Profile (Lean HOA ←→ Full‑service HOA).
    • Historic + Full‑service (this unit): Buyer values provenance and staffing over dues drag; cash or low‑LTV; long‑hold bias.
    • Historic + Lean: Boutique walk‑ups with lower staff overhead; fewer services, lower dues.
    • Contemporary + Full‑service: Amenity towers (valet, gym, pool; e.g., 2015 Lumina); convenience at higher dues.
    • Contemporary + Lean: Newer mid‑rises without 24/7 staff; broader financed buyer base.

Named‑stakeholder breakdown

  • 1001 California HOA: $5,432/month equals ≈ $1.82/sq ft, or ≈ $65,184/year from this unit alone—stabilizing reserves and services; a near‑ask sale helps future refis and capital planning. [2]
  • Sotheby’s International Realty (Castellanos, Bennett): The pitch leans on Sawyer’s façade, Patty Hearst’s 1970s chapter, and Nob Hill’s “fourth corner” across from the Fairmont and Pacific‑Union Club, because pure “value per foot” comps won’t carry it. [1][2]
  • Buyer profile: Cash or ultra‑low‑LTV households, often with multiple homes, seeking boardroom‑grade reception rooms; broader SF condo data show recovery pockets, but taste and overhead tolerance will dominate this micro‑trade. [5][6]

Historical analogue

  • During the 1991 recession and again after the 2001 dot‑com bust, Pacific Heights and Nob Hill full‑floor prewar resales saw thin volume but resilient premiums due to finite sets (specific architects, single‑floor layouts, protected view corridors). This 1914 Sawyer top floor fits that scarcity script.

What to watch next

  1. Status by November 30, 2026: either under contract or price‑reduced by ≥5% from $5.2M; binary check on whether the market clears the ask.
  2. Closing by February 28, 2027 at $4.7M–$5.3M vs. a miss outside that band; this brackets a ±6% tolerance around ask.
  3. Days on Market surpasses 120 days by December 31, 2026 if not in contract; tests the “trophy insulation” thesis against rate‑driven inertia.

Sources

[1] SFGATE — Listing feature on 1001 California St., No. 7; confirms 2,980 sq ft, $5.2M ask, 1914 build, Patty Hearst history, and prior sale.
What this contributes: Core property facts, provenance, and sale history.

[2] Sotheby’s International Realty (listing for 1001 California St., No. 7) — Marketing brochure and MLS details, including $5,432/month HOA, parking as “on site – monthly fee,” and agent names.
What this contributes: Dues, parking structure, and agent of record.

[3] City and County of San Francisco Treasurer & Tax Collector — FY 2025–26 secured property tax rate (1.18268325%).
What this contributes: Official property tax rate used in carrying‑cost math.

[4] Mortgage News Daily — Jumbo 30‑year fixed average around 6.78% as of August 24, 2026.
What this contributes: Rate assumption for the mortgage calculation.

[5] Redfin Data Center — San Francisco citywide median price per square foot (~$1,090, 2026 YTD).
What this contributes: Citywide pricing benchmark.

[6] Redfin Neighborhoods (Nob Hill) — Neighborhood median price per square foot (~$1,300).
What this contributes: Localized comp baseline.

[7] Bankrate Mortgage Calculator — Standard amortization model used to reproduce the ~$27,065/month P&I on $4.16M at ~6.78% over 30 years.
What this contributes: Methodology for payment math.

[8] City and County of San Francisco — Real Property Transfer Tax Rates (2.25% for $5M–$10M).
What this contributes: Closing‑cost input relevant to net proceeds and negotiations.

[9] IRS Publication 936 (Home Mortgage Interest Deduction) — $750,000 cap enacted by the Tax Cuts and Jobs Act (2017) and SALT deduction limits.
What this contributes: Tax‑treatment constraints on high‑balance mortgages.

[10] SpotHero (San Francisco monthly parking listings, Nob Hill/California St. corridor) — Typical 2026 monthly rates in the ~$400–$650 range.
What this contributes: Operating cost proxy for non‑deeded parking.


Related update: We recently published an article that expands on this topic: read the latest post.

Related update: We recently published an article that expands on this topic: read the latest post.
Rising Mortgage Rates Squeeze Demand | Analysis by Brian Moineau

TL;DR

  • Mortgage rates climbed to a one-year high last week and immediately dented demand; applications fell 2.9% week over week and 5% year over year, with refinance activity down 9% versus 2025 [1].
  • The rate spike is tethered to energy headlines: oil’s drop early this week briefly pulled yields and mortgage rates lower again, underscoring how the Iran war shock is dictating borrowing costs as much as the Fed is [1][2][3].
  • Prices aren’t cracking: Redfin says the median sale price sat about $800 below its all-time high in mid-July near $408,804, so higher mortgage rates are squeezing affordability rather than forcing broad price declines [4].

What the source said

CNBC reports mortgage demand slumped as the average contract rate for a 30‑year fixed with conforming balances rose to 6.81% (points: 0.65, from 0.69) after the July FOMC meeting, with total applications down 2.9% week to week and 5% year over year [1]. Refinances dropped 2% on the week and 9% year over year, while purchase apps fell 4% week to week and 3% year over year, according to the MBA print carried by CNBC [1]. Mortgage News Daily observed rates eased to two‑week lows at the start of this week as Iran‑war rhetoric cooled and oil slipped, helping bonds and lender pricing [5]. MBA’s Mike Fratantoni said higher mortgage rates “weakened overall demand,” a comment carried in the August 5 CNBC write‑up [1].

Why it matters

The real stakeholders aren’t “homebuyers” in the abstract—they’re first‑timers in Phoenix or Tampa sizing their budgets against Redfin’s $408,804 national median, move‑up owners who locked ~3% mortgages in 2020–2021 per Freddie Mac archives, and lenders like Rocket Mortgage that live on daily rate sheets [4][6]. When mortgage rates pop on geopolitical oil scares, buyers don’t just delay—they lose purchasing power while list prices hold near records, and that redirects demand toward builder incentives, smaller homes, FHA, or the sidelines [1][4].

For the industry, the stakes extend past a slow August 2026. With Freddie Mac’s benchmark 30‑year rate printing 6.69% on August 6 and Redfin’s median price hovering just under peak, the gap between wages and monthly payments is widening again into Q3 2026 [2][4]. If the oil‑driven rate premium persists into fall, pipelines at lenders and agents thin out while builders like D.R. Horton lean harder on buydowns and credits to keep model‑home traffic converting [2][4].

Original analysis

Back‑of‑envelope: the payment punch

  • Assumption: national median sale price $408,804 in mid‑July (Redfin). With 20% down, loan amount ≈ $327,043 [4].
  • Payment at 6.81% (30‑yr): ≈ $2,134/month P&I (standard amortization on $327,043).
  • Payment at 6.49% (early‑July average per PMMS/MND): ≈ $2,065/month [5][6].
  • Delta from 6.49% to 6.81%: ≈ $69/month, or ~$828/year—enough to tip debt‑to‑income approvals at the margin [5][6].

This math explains why purchase apps retrench when headlines swing rates; a $69/month move isn’t abstract to a first‑time buyer near DTI limits, and it arrives faster than wages adjust or sellers cut list prices [1][4].

Contrarian read

  • Consensus: “Higher mortgage rates will finally force home prices down.”
  • My case: In 2026, higher rates are depressing transactions more than prices because inventory remains constrained and demand is elastic to payments, not sticker price; Redfin’s July read shows the median sale price about $800 below the all‑time high even as pending sales softened when the daily average rate flirted with a one‑year high near 6.85% in late July [4][5].

The more relevant lever isn’t the sticker; it’s the financing bundle. MBA’s survey shows average points fell to 0.65 from 0.69 even as the contract rate hit 6.81%, signaling lenders adjusted fees to keep APRs competitive when volatility spiked [1].

Historical analogue: 2013’s taper‑tantrum, updated

In mid‑2013, mortgage rates jumped from roughly 3.6% to 4.3–4.5% after the Fed’s taper talk; purchases cooled and refinances slumped, but prices advanced into year‑end, as the St. Louis Fed documented in a 2017 review [6][7]. Today rhymes—with a twist: the catalyst isn’t QE chatter; it’s geopolitics via oil, as seen when rates spiked into late July 2026, Freddie Mac’s weekly survey clocked 6.69% on August 6, then eased as crude fell on Iran de‑escalation headlines [2][3][5]. Expect choppy volumes and sticky prices again, not a straight‑line correction into Q4 2026 [2][4].

2x2: rate level vs. inventory tightness

  • High rates + tight inventory (July–August 2026): Low transactions, firm prices; builders deploy buydowns, and portals like Zillow/Redfin see steady traffic but weaker conversion [4][5].
  • High rates + loose inventory: Prices soften; 2018‑style discounts reappear; lock desks prioritize fee cuts over rate cuts to keep APRs steady [6].
  • Low rates + tight inventory: Bidding resurges; lenders refocus on capacity; refi mini‑cycle appears in cash‑out and consolidation cohorts near sub‑6.5% [5][6].
  • Low rates + loose inventory: Broad price discovery; sellers capitulate faster; volumes and prices both stabilize on affordability relief [6].

Named‑stakeholder breakdown

  • Rocket Mortgage, UWM, Mr. Cooper: Volatility is the business; headline rates near 6.85% in late July forced fee tinkering, while any sustained drift toward the mid‑6s could spark a small refi mini‑cycle in cash‑outs and debt consolidation [1][5].
  • D.R. Horton, Lennar, Pulte: Builders can manufacture “price” via 2‑1 buydowns and closing credits; oil‑driven dips in rates create brief booking windows, so sales teams will lean into lock‑and‑shop when Iran headlines soften [3][5].
  • Zillow, Redfin: With the median price near peak and new‑listing flow thin, site traffic holds while conversion hinges on payments; Redfin’s tracker shows pending sales move almost tick‑for‑tick with rate changes [4][5].

What others are missing

The oil‑to‑mortgage channel isn’t only wiggling the 10‑year; it’s reshaping the fee stack at the lock desk. MBA’s survey shows points fell to 0.65 even as the rate hit 6.81%, and Mortgage News Daily logged rapid lender repricing when Iran headlines eased and oil slipped, which means affordability now turns on a bundle—rate, points, and concessions—optimized (or not) against energy shocks [1][5]. Coverage that fixates on the headline rate misses those competitive tactics and the approval impact when lenders swap small rate moves for fee changes during intraday rallies [1][5].

What to watch next

  1. By September 30, 2026, Freddie Mac’s weekly 30‑year average prints below 6.5% at least once if Brent holds under $85/barrel for two consecutive weeks; otherwise it does not, linking crude to rate relief [2][3].
  2. By Q4 2026, the national median sale price sets a new high even if purchase apps remain below 2025 levels, confirming that volume—not price—is the primary shock absorber in this cycle [1][4].
  3. By October 31, 2026, at least two top‑10 builders report buydowns on 60%+ of Q3 closings in earnings commentary or 10‑Qs, reflecting payment‑first buyer behavior.

My take

I don’t buy the “rates up, prices must fall” story for H2 2026. Mortgage rates are being yanked by oil headlines as much as by the Fed, so every de‑escalation is a tradable window for locks, and every flare‑up steals approvals from the edge [2][3][5]. If you run a sales desk at a lender or a brokerage, build playbooks around volatility, not levels: capture locks on dips, pivot borrowers to lower‑point structures when oil pops, and borrow builder‑style incentives where you can [1][4][5]. The winners this year will be the fastest optimizers of payment per dollar, not the boldest price cutters [1][2][4][5].

Sources

  1. Mortgage rates hit their highest level in over a year, causing demand to drop below year-ago levels — CNBC (https://www.cnbc.com/2026/08/05/mortgage-rates-hit-their-highest-level-in-over-a-year.html) — MBA application data, 30‑year contract rate at 6.81%, and points shift signal fee tactics.
  2. Mortgage rates rise for 5th straight week, hitting levels not seen since 2025 for 2nd week in a row — AP (https://apnews.com/article/42d8262fb00b904fd7c2b906751610d7) — Freddie Mac’s 30‑year fixed at 6.69% on Aug. 6 and yield/inflation context.
  3. Oil prices drop after Trump orders US forces to hold off on new strikes against Iran — AP (https://apnews.com/article/194ab3d3130bb44de445cf3d05954beb) — Link between de‑escalation headlines and a crude drop that eased yields.
  4. Pending Home Sales Slip Amid Stubbornly High Housing Costs, Economic Uncertainty — Redfin (https://www.redfin.com/news/press-releases/pending-home-sales-slip-amid-stubbornly-high-housing-costs-economic-uncertainty/) — Median sale price near $408,804 and sensitivity of pending sales to weekly rate moves.
  5. Mortgage Rates Roughly Unchanged Versus Friday’s Lows — Mortgage News Daily (https://www.mortgagenewsdaily.com/markets/mortgage-rates-07272026) — Late‑July daily rate highs near 6.85% and commentary on lender repricing vs. oil/Iran news.
  6. Mortgage rates and affordability (PMMS background and archives) — Freddie Mac (https://www.freddiemac.com/pmms/pmms_archives) — Historical perspective on 2020–2021 sub‑3% rates and early‑July 2026 averages for comparisons.
  7. Could Housing Markets Face Another “Taper Tantrum” Moment? — St. Louis Fed (https://www.stlouisfed.org/on-the-economy/2017/march/housing-markets-face-taper-tantrum-moment) — 2013 analogue showing rate spikes slowed activity without a full‑blown housing slump.

Dimon Warns: Market Shock Risk Rising | Analysis by Brian Moineau

TL;DR

  • Jamie Dimon, JPMorgan’s CEO, has warned since at least the 2023 shareholder letter that higher-for-longer rates, war risk, and fiscal deficits could hit assets; the deeper fuse is U.S. debt rollover colliding with persistent Treasury supply and finite balance sheets. [1][2]
  • Even with June CPI around 3.5% year over year, the 10-year Treasury hovered near 4.6% in mid-July 2026; that level sits well above the government’s current average interest rate on outstanding debt, implying net interest keeps trending higher as low-coupon notes reset. [3][4][5]
  • The 2022 UK gilts shock showed how a long-end spike (30-year yields jumping roughly 130–140 bps in days) can trigger forced selling; the U.S. won’t replay LDI, but heavy funding needs plus convexity and dealer limits can rhyme. [6]

What the source said

In the 2023 JPMorgan shareholder letter, Jamie Dimon flagged persistent inflation, geopolitical conflicts (notably Russia–Ukraine and Middle East hotspots), and fiscal deficits as reasons rates could stay high and markets could see a shock; he argued investors should not assume a smooth disinflation glide path like the mid-1980s. He linked these risks to potential pressure on both equities and bonds if term premia rise and cash flows get discounted at higher rates. He framed bank operating conditions as strong in 2023–2024 but warned they can change quickly if funding costs or credit losses climb. [1]

Why it matters

  • Primary dealers in New York, U.S. money market funds, and foreign reserve managers in places like Tokyo and Beijing finance the Treasury’s deficits, while retirees on Social Security and Medicare, and S&P 500 firms rolling debt, depend on the cost of that funding. If “vigilantes” demand more term premium, the 10-year at roughly 4.55%–4.60% in mid-July 2026 can lift mortgage rates, capex hurdles, and equity discount rates even after a soft CPI headline. [3][4]

  • Traditional 60/40 allocators, banks’ AFS/HTM books, and long-duration ETFs such as iShares TLT (launched 2002) face path risk that inflation prints alone won’t capture; the UK’s 2022 episode showed 30-year gilts spiking about 130–140 bps within days and forcing deleveraging, while TLT itself lost roughly 31% in calendar 2022 during the U.S. rate shock. [6][7]

Original analysis

Dimon’s “shock” setup rests on rates, geopolitics, and deficits. The common reply says: core inflation is easing, so yields drift lower; flare-ups are priced; deficits matter later. I disagree because the plumbing points to supply, rollover, and balance-sheet constraints that act now.

Contrarian read

  • Consensus: Softer CPI = lower yields = duration relief.
  • Counter: Supply and rollover are repricing duration irrespective of CPI. June CPI ran near 3.5% y/y while the 10-year sat around 4.6%, and recent Treasury refunding guidance emphasized steady coupon auction sizes over “at least the next several quarters,” a stance that can buoy term premia when dealer capacity is finite. [3][4][8]

Back-of-envelope calculation (rollover wedge)

  • Facts:
    • Debt held by the public was roughly $29.7 trillion around late 2025, per Treasury’s Debt to the Penny dataset. [9]
    • The weighted average maturity (WAM) of marketable debt was about 70.8 months (≈5.9 years) as of October 31, 2024. [8]
    • The average interest rate on outstanding Treasury marketable debt ran near 3.4% in 2025–2026 per Treasury’s dataset. [5]
    • The 10-year yield in mid-July 2026 printed around 4.55%–4.60%. [4]
  • Mechanics:
    • If WAM ≈ 70.8 months, about 12/70.8 ≈ 17% of the portfolio resets per year.
    • 17% × $29.7T ≈ $5.0T rolling in the next 12 months.
    • Rate gap vs. legacy average cost: 4.60% − 3.40% ≈ 1.20 percentage points.
    • Extra annualized interest from this year’s roll: 1.20% × $5.0T ≈ $60B.
  • Interpretation: That is just year one; as more low-coupon notes roll in 2027–2028, the wedge compounds if the 10-year hangs near 4.6%, regardless of monthly CPI noise. [4][5][9]

Historical analogue: UK gilts, September–October 2022

  • The “mini-budget” shock was not about surprise inflation; it was about sudden term-premium repricing to fund deficits and hedge leverage, with 30-year yields jumping roughly 130–140 bps in a few days, forcing LDI selling and a Bank of England liquidity backstop. The U.S. has deeper markets and no LDI ubiquity, yet persistent supply plus convexity and dealer VAR limits can still pressure the long end quickly. [6]

A simple 2×2: supply vs. risk capacity

  • High supply + thin risk capacity (e.g., big refundings during bank VAR constraints): risk of sharp yield spikes and auction tails.
  • High supply + ample risk capacity (e.g., strong dealer balance sheets and risk-on credit): gradual bear steepening.
  • Low supply + thin risk capacity: choppy range trading with occasional squeezes; term premium can still stay positive.
  • Low supply + ample risk capacity: benign decline in long-end yields; this is the cyclical “soft landing” case and requires deficits to narrow or issuance to skew short.

Named-stakeholder breakdown

  • U.S. Treasury: Recent Quarterly Refunding materials and TBAC slides signal maintaining coupon auction sizes and a stable WAM, which keeps a steady duration pipe flowing into a market where dealers must warehouse risk. [8]
  • JPMorgan, Goldman Sachs, and Bank of America: Trading desks benefit from volatility, but a violent long-end selloff stresses client collateral, increases margin calls, and can dampen primary issuance in New York and London.
  • 60/40 allocators and long-duration ETFs (e.g., TLT): If the 10-year revisits 5% without a growth scare, equity multiples compress while bond NAVs fall—hurting both legs at once; the 2022 TLT drawdown of about −31% shows the convexity bite. [4][7]

One more inconvenient anchor: deficits

  • The CBO’s long-term projections show debt held by the public reaching roughly 116% of GDP by 2034 with primary deficits persisting, implying sustained issuance and a positive term premium absent policy changes; this fiscal backdrop amplifies the rollover wedge described above. [2]

What others are missing

Most coverage centers on “inflation vs. the Fed,” but the under-covered angle is the portfolio’s effective reset speed—call it WANRR, the weighted average next repricing rate. Bills and FRNs shorten the government’s true interest-rate sensitivity; TBAC slides show bills plus FRNs comprising roughly the high-30s percent of marketable debt in 2024, far quicker to reprice than 7–10 year notes. That accelerates the pass-through from a 10-year near 4.6% to the average interest rate, which Treasury’s dataset shows climbing as legacy sub-2% coupons from 2020–2021 roll away. [8][4][5][3]

What to watch next

  1. By October 31, 2026, the 10-year Treasury yield (FRED series DGS10) records a weekly average at or above 5.00% for at least one week, indicating term premium and supply pressure overcame benign CPI prints. [4]

  2. By December 31, 2026, at least one 30-year Treasury bond auction (new issue or reopening) tails by 3.0 basis points or more versus the when-issued yield at the 1:00 p.m. ET deadline, signaling constrained balance-sheet capacity at primary issuance. [10]

  3. By March 31, 2027, iShares TLT posts a total return of −10% or worse from the July 15, 2026 close to that date (using NAV total return on the fund’s page), consistent with duration pain despite moderating CPI. [7]

Sources

[1] JPMorgan Chase 2023 Shareholder Letter (Jamie Dimon) — outlines CEO views on higher rates, geopolitics, and market risk, anchoring the “shock” narrative.

[2] Congressional Budget Office — Long-Term Budget Projections — provides deficit and debt-to-GDP trajectories that inform issuance and term-premium pressure.

[3] U.S. Bureau of Labor Statistics — Consumer Price Index — supplies CPI data used for the June year-over-year reading and inflation context.

[4] Federal Reserve Bank of St. Louis (FRED) — 10-Year Treasury Constant Maturity (DGS10) — benchmark for long-end yields and the 4.6% reference point.

[5] U.S. Treasury FiscalData — Average Interest Rates on U.S. Treasury Securities — tracks the average coupon cost on outstanding debt to compare against current yields.

[6] Bank of England — Financial Stability Report, December 2022 — documents the UK gilt crisis mechanics, LDI deleveraging, and yield spike magnitudes.

[7] iShares — TLT (20+ Year Treasury Bond ETF) — provides historical performance and duration metrics to illustrate convexity and drawdown risk.

[8] U.S. Treasury — Treasury Borrowing Advisory Committee (TBAC) Q4 2024 Presentation — shows WAM, issuance mix, and debt composition (bills/FRNs vs. coupons).

[9] U.S. Treasury FiscalData — Debt to the Penny — gives levels for debt held by the public to size the rollover base.

[10] U.S. Treasury — Auction Query (official results) — verifies auction tails and bid metrics for 30-year bond sales.


Related update: We recently published an article that expands on this topic: read the latest post.

30-Year Yield at 5%: Pressure on Borrowing | Analysis by Brian Moineau

The long end is talking: why the 30‑year yield hovering around 5% matters

The yield on 30‑year US government debt hovered around 5% this week, and that simple sentence carries a lot of freight. Long‑term Treasury yields aren’t just an abstract market statistic — they’re a price signal that ripples into mortgage rates, corporate borrowing costs, pension funding, and how investors price risk across the global economy. When the 30‑year yield touches a round number like 5%, markets and money managers pay attention because it’s both psychological and practical: borrowing math changes, balance sheets flex, and strategy conversations shift.

Let’s walk through why this move is more than noise, what’s driving it, and what to watch next.

Why a 5% 30‑year yield is news

  • A higher 30‑year yield means the government pays more to borrow for three decades. That raises the baseline for long‑term interest rates across the economy.
  • Mortgage rates tend to track the long end; when the 30‑year Treasury rises, so does the cost of a 30‑year fixed mortgage, squeezing housing affordability.
  • Pension plans and insurers mark long liabilities to market prices; sustained higher yields alter funding ratios and the economics of fixed‑income allocations.
  • The long end reflects expectations about inflation, growth, fiscal policy and global demand for safe assets — it’s where the “what‑do‑we‑really‑expect over decades” conversation happens.

Put simply: moves at the long end force investors and policymakers to re‑ask the question, “How expensive will money be for the next generation?”

The yield on 30‑year US government debt hovered around 5% — what pushed it there?

Several factors have conspired to nudge the long‑end higher:

  • Inflation and inflation expectations: Even if headline CPI has cooled from its peak, stickier or unpredictable prices keep investors demanding higher compensation for tying money up for 30 years.
  • Fed policy and rate path bets: If markets push back expectations for Federal Reserve rate cuts — or see a risk the Fed may stay restrictive longer — long yields can rise as investors price in a higher neutral rate or slower easing.
  • Fiscal dynamics and issuance: Large or persistent deficits mean more Treasury supply. If global demand for long‑dated paper softens, yields need to move up to attract buyers.
  • Geopolitical and market stress: Events that change risk perceptions (commodity shocks, trade disruptions, regional conflicts) can alter both inflation expectations and safe‑asset flows, putting upward pressure on long yields.
  • Technicals and liquidity: Auction weakens, lower foreign buying, or flows out of long‑duration ETFs can amplify a move once it starts.

Those forces don’t act in isolation. The market is sensitive to small changes in each — and when they line up, the long end can move quickly.

What it means for everyday markets and people

  • Mortgages and housing: Long‑term mortgage rates often move with the 30‑year Treasury. A sustained rise toward or above this 5% zone lifts monthly payments for new homebuyers and can chill refinancing activity.
  • Corporate borrowing and investment: Companies issuing long‑dated bonds face higher interest costs, which can alter capital expenditure plans and valuations.
  • Risk assets: Higher long yields can make bonds more attractive versus stocks, or at least raise the hurdle rate for equities — especially for growth companies whose valuations rely on low discount rates.
  • Government interest expense: Higher long yields increase the present value cost of future debt. For a large issuer like the U.S., that matters for budget math if yields stay elevated.
  • Savers and retirees: Higher yields on long Treasuries can be a silver lining for savers who can ladder or buy duration; but pension plans may mark down liabilities, creating funding headaches.

A closer look at the signal: is this a temporary blip or a regime shift?

This is the central debate. A few ways to think about it:

  • Temporary shock view: If the rise is driven by a transitory supply/demand mismatch, geopolitical blip, or a momentary repricing of Fed timing, yields can retreat once the shock subsides.
  • Structural view: If the market is re‑establishing a higher equilibrium for long rates — because inflation expectations have permanently risen, fiscal pressures are larger, or the global appetite for long duration has waned — then 5% may be the new normal for the long end (or a floor, not a ceiling).

History shows both patterns: yields spike and fall around shocks, but they also trend to new ranges when the macro backdrop changes. The cadence of incoming inflation data, the Fed’s communications and Washington’s fiscal trajectory will be the deciding factors.

What investors and policymakers should watch next

  • Inflation prints and the Fed’s language about policy normalization or cuts.
  • Treasury auction results and demand from core buyers (domestic real money managers, foreign central banks).
  • Data on mortgage rates and housing activity — they’ll reveal how the rate move is transmitting to the real economy.
  • The shape of the yield curve: persistent steepening or flattening tells different stories about growth and recession risk.
  • Global yields: long bonds elsewhere moving higher can validate a global re‑pricing, while an isolated U.S. rise points to domestic fiscal or policy drivers.

Market mood and strategy implications

  • For fixed‑income investors: higher long yields reopen income opportunities — ladders and high‑quality duration can become attractive again — but timing matters if volatility spikes.
  • For equity investors: reassess duration risk in portfolios, favor cash‑generating businesses if discount rates rise, and watch sectors more sensitive to financing costs.
  • For households: locking mortgage rates or reassessing refinancing math may make sense if you expect yields to stay higher for months.
  • For policymakers: a durable rise in long yields forces honest conversations about deficit paths and monetary‑fiscal interactions.

My take

The 30‑year yield flirting with 5% is a reminder that the bond market often gets ignored until it tugs on the rest of the economy. This isn’t an automatic recession signal — but it is a market vote demanding clarity. Investors and policymakers should treat the move as both a risk and an opportunity: risk if it’s the start of a sustained repricing that pressures growth; opportunity if elevated yields buy savers and long‑duration buyers income they haven’t seen in years.

In short: markets are asking for a clearer plan — on inflation, on Fed timing, and on fiscal responsibility. How those answers arrive will determine whether 5% is a headline or the new baseline.

A few practical takeaways

  • Revisit duration exposure: consider whether you want to lock yields now or wait for volatility to subside.
  • Homebuyers: check refinance vs. purchase math quickly — small yield moves change monthly payments meaningfully.
  • Watch the data calendar: inflation, payrolls, and Treasury auctions will shape the next moves.

Sources


Related update: We recently published an article that expands on this topic: read the latest post.


Related update: We recently published an article that expands on this topic: read the latest post.

How a Fed Cut Lowers $600K Mortgage | Analysis by Brian Moineau

How much cheaper does a $600,000 mortgage feel after the Fed’s December rate cut?

You probably felt it in your inbox and on the housing feeds: lenders nudging rates down, refinance calculators lighting up, and that nagging “what-if-I-wait” question growing louder. The Federal Reserve’s December 2025 rate cut didn’t instantly rewrite mortgage math — but it did make a noticeable dent in monthly payments for many buyers. Let’s walk through what that means if you’re looking at a $600,000 mortgage, why the change matters, and how to think about timing.

Why a Fed cut matters (even if mortgage rates don’t follow directly)

  • The Fed sets the federal funds rate, which affects short-term borrowing costs and market sentiment.
  • Mortgage rates are driven by longer-term Treasury yields, lender risk, and market expectations — not the Fed rate itself.
  • Still, Fed cuts often push Treasury yields lower and ease financial conditions, which tends to put downward pressure on mortgage rates over time.

So the Fed’s move is more like turning down the thermostat in a crowded room: it won’t immediately cool everything to the same temperature, but it changes the environment and expectations — and lenders respond.

What the numbers look like now

Using the rate levels reported after the Fed’s December 2025 cut, today’s average mortgage rates translate into the following monthly principal-and-interest payments on a $600,000 loan:

  • 30‑year fixed at 5.99% → $3,593.45 per month. (cbsnews.com)
  • 15‑year fixed at 5.37% → $4,861.21 per month. (cbsnews.com)

To give those numbers some context, at the start of 2025 the averages were much higher:

  • 30‑year fixed at 7.04% → $4,007.95 per month. (cbsnews.com)
  • 15‑year fixed at 6.27% → $5,151.08 per month. (cbsnews.com)

That gap means a 30‑year borrower locking today would pay about $415 less per month (roughly $4,974 a year) compared with January 2025 rates — real breathing room on a sizeable mortgage. (cbsnews.com)

How meaningful is that change?

  • Monthly relief: Several hundred dollars a month can affect affordability, debt-to-income ratios, and the size of homes buyers can realistically consider.
  • Long-run savings: Lower interest rates over 30 years compound into tens of thousands of dollars in interest savings.
  • Market behavior: Easier rates can nudge more sellers to list homes and more buyers to act, which can tighten inventory and push prices up — offsetting some of the rate benefit in hot markets.

Remember: averages reported by Freddie Mac and rate trackers reflect the national picture; your local rate will depend on your credit score, down payment, lender fees, loan type, and whether your loan is conforming or jumbo. (apnews.com)

Should you lock now or wait for 2026?

  • Expectation vs. reality: Markets are pricing in more easing but not a guaranteed plunge. Some economists expect one or a few modest additional cuts in 2026; lenders may already price that in.
  • Opportunity cost: Waiting can save money if rates fall more — but it also risks higher home prices, increased competition, and months of uncertainty.
  • Practical rule: If you’ve found a home you can afford comfortably at today’s payments, locking secures your payment and removes rate risk. If you’re flexible and prefer to shop rates, be ready to act quickly if a clear downtrend appears.

The CBS analysis notes that many lenders have already baked in expectations for future cuts, meaning additional Fed easing might have a muted direct effect on posted mortgage rates; refinancing later is often the path buyers take if rates fall further. (cbsnews.com)

A few tactical tips

  • Shop widely: Small differences in points and fees change effective rates. Get multiple lender quotes and compare APRs.
  • Consider loan types: A 15‑year will save interest but cost more monthly; ARMs may help short-term buyers but carry re‑rate risk.
  • Improve your profile: Better credit, a larger down payment, and lower debt-to-income can unlock lower quoting rates.
  • Think refinance, not regret: If you buy now and rates fall materially, you can usually refinance — though you’ll pay closing costs and have to weigh break-even timing.

What I’m watching next

  • Treasury yields: These have the biggest sway on longer-term mortgage pricing.
  • Inflation data and job reports: Stronger-than-expected numbers can push yields (and mortgage rates) back up.
  • Fed guidance: Any explicit signal about the pace of future cuts or balance-sheet steps will move markets.

My take

The Fed’s December cut was welcome news for buyers and borrowers — it translated into meaningful monthly savings versus the painful first half of 2025. But the mortgage market doesn’t move in lockstep with Fed announcements, and the difference between “good enough” and “perfect” often comes down to personal circumstances. If the monthly payment at today’s rates fits your budget and matches your life plan, there’s solid logic to locking and moving forward. If you decide to wait for lower rates, do it with a clear timeline and contingency plan.

Sources


Related update: We recently published an article that expands on this topic: read the latest post.

Fed’s Small Cut, Big Year of Uncertainty | Analysis by Brian Moineau

A small cut, big questions: why the Fed’s December move matters more than the math

The Federal Reserve is set to act this week — widely expected to shave 25 basis points off its policy rate at the December 9–10 meeting — but the decision feels less like a crisp policy pivot and more like a weather forecast for a very foggy year ahead. Markets are pricing the cut as likely, yet Fed officials remain sharply divided about what comes next. That tension is the real story: a “hawkish cut” that eases today while signaling caution about tomorrow. (finance.yahoo.com)

Why this cut is different

  • It’s small and tactical: officials are likely to cut by 0.25 percentage points — a modest easing intended to support a slowing labor market rather than to ignite growth. (finance.yahoo.com)
  • It’s politically and institutionally noisy: unusually high numbers of dissents and public disagreement among Fed officials have surfaced, weakening the usual appearance of consensus. (wsj.com)
  • It’s defensive, not directional: the messaging is expected to emphasize that further cuts are not guaranteed and will depend on incoming data, especially payrolls and inflation signals. That is the essence of a “hawkish cut.” (finance.yahoo.com)

What led the Fed to this crossroads

Over the past year the Fed has moved from aggressive tightening (to fight high inflation) to cautious easing as jobs growth cooled and signs of economic slowing mounted. With inflation still above target in some measures and the labor market showing cracks, policymakers face two conflicting risks: easing too much could reignite inflation; easing too little could let a slowdown deepen into a recession. That trade-off explains why the Fed looks divided going into the meeting. (wbtv.com)

  • Labor market softness has become a central worry — slowing hiring and rising unemployment risk a broader slowdown. (wbtv.com)
  • Inflation remains a lingering concern, meaning many officials are reluctant to commit to a path of multiple cuts. (wbtv.com)

How markets will read the move

Expect three distinct market reactions depending on the Fed's communication:

  1. “Hawkish cut” narrative — Fed cuts now but signals a pause: short-term yields fall, risk assets rally modestly, but the rally is contained because the door for further easing is left mostly shut. This is the scenario many strategists expect. (finance.yahoo.com)
  2. Clear easing path signaled — Fed telegraphs additional cuts: bond yields and the dollar drop further, and equities get a stronger lift. Unlikely given current internal divisions but possible if data deteriorates. (reuters.com)
  3. Mixed message or large dissent — uncertainty spikes, volatility rises, and markets trade on headline interpretation rather than on concrete guidance. The Fed’s historic preference for consensus makes any multi-dissent outcome notable. (wsj.com)

CME Fed funds futures currently put a high probability on a 25 bps cut this week, but the outlook for January and beyond is much murkier — traders assign materially lower odds to a sustained easing cycle. That mismatch between near-term pricing and medium-term uncertainty is what creates the “year of unknowns.” (finance.yahoo.com)

What to watch in the Fed’s statement and Powell’s press conference

  • Language around “neutral” or “restrictive” policy: small wording shifts will be parsed for signs of more cuts. (wsj.com)
  • References to the labor market and downside risks to employment: clear talk of deterioration would open the door to additional easing. (wbtv.com)
  • Any explicit guidance on the balance sheet or Treasury bill purchases: the Fed might use Reserve Management Purchases (RMP) or other tools to manage liquidity — an outcome that could surprise markets beyond the headline rate cut. (reuters.com)

What this means for everyday borrowers, savers, and investors

  • Borrowers: A 25 bps cut can ease some short-term borrowing costs (credit cards, some variable-rate loans), but mortgage rates and longer-term borrowing are more sensitive to broader yield moves and inflation expectations, so homeowners may see only modest relief. (finance.yahoo.com)
  • Savers: Any improvement in savings rates will likely be gradual; banks don’t always pass every Fed cut through to deposit rates. (finance.yahoo.com)
  • Investors: Volatility is the likely constant. Strategies that focus on quality, cash flow, and duration management will generally fare better than high-beta short-term plays in an uncertain policy regime. (finance.yahoo.com)

Quick wins for readers who want to navigate the uncertainty

  • Keep an eye on jobs, inflation, and Fed communications — those three datapoints will steer the odds for any further cuts. (wbtv.com)
  • Reassess duration exposure in fixed-income portfolios: small cuts can lower short-term yields quickly but have a less predictable effect on long-term rates. (reuters.com)
  • For households, prioritize emergency savings and fixed-rate borrowing if you expect rates to drift unpredictably. (finance.yahoo.com)

Final thoughts

A rate cut this week would be a pragmatic, defensive step: the Fed is trying to support a labor market that looks wobbly without declaring a new era of accommodative policy. But the split among policymakers matters. When a central bank is divided, its future path is harder to forecast — and that uncertainty can ripple through markets and everyday decisions more than the quarter-point itself. In short: the math of a 25 bps cut is simple; the message the Fed sends afterward is what will determine whether 2026 becomes steadier or more unsettled. (finance.yahoo.com)

What I’m watching next

  • The Fed’s statement and Chair Powell’s December 10 press conference for clues about the January meeting and balance-sheet tools. (finance.yahoo.com)
  • December labor-market releases and inflation prints for signs that could prompt either more easing or a pause. (wbtv.com)

Notes for readers

  • The Fed meeting dates are December 9–10, 2025; markets and commentators are highly focused on both the rate decision and the tone of the Fed’s forward guidance. (finance.yahoo.com)

Sources


Related update: We recently published an article that expands on this topic: read the latest post.

Related update: We recently published an article that expands on this topic: read the latest post.

Bond Traders Challenge Fed Credibility | Analysis by Brian Moineau

When Bond Traders Ignore the Fed: A Dinner-Table Argument for Markets and Democracy

The financial world loves a paradox: the Federal Reserve cuts its policy rate, signaling easier money, yet long-term Treasury yields climb instead of falling. That’s exactly what’s happening now — and it’s touching off a heated debate that’s part market mechanics, part politics, and entirely consequential for anyone who pays a mortgage, runs a business, or watches Washington.

(finance.yahoo.com)

Why this feels like a grab for attention

  • The Fed has been easing from highs set in 2024, cutting the federal funds target by roughly 1.5 percentage points so far. Traders expect more cuts. Yet 10- and 30-year Treasury yields have moved higher, not lower. That mismatch is uncommon outside of certain episodes in the 1990s and has market strategists scratching their heads. (finance.yahoo.com)

  • The timing is politically charged: President Trump will soon be able to nominate Jerome Powell’s replacement, and market participants are already debating what a politically aligned Fed chair could mean for inflation, credibility, and long-term borrowing costs. Fear: a Fed that caves to pressure to ease too far could stoke inflation and push yields even higher. (finance.yahoo.com)

The competing explanations (pick your favorite)

  • A hopeful reading: Rising long-term yields reflect confidence. Investors expect stronger growth and lower recession risk, so they demand less duration protection — higher yields are a payoff for an economy that’s not collapsing. (finance.yahoo.com)

  • A structural adjustment view: Some say this is a return to pre-2008 market norms — less central-bank dominance, markets pricing in real macro variables (growth, fiscal stance, term premium) rather than simply shadowing policy rates. (finance.yahoo.com)

  • The bond vigilante scenario: Creditors are worried about a swelling U.S. debt burden and a politically compromised Fed. If traders think the central bank will prioritize short-term political goals over price stability, they’ll demand higher yields as compensation for future inflation or fiscal risk. That narrative has gained traction as talk of a political appointee to the Fed intensifies. (finance.yahoo.com)

What’s at stake for ordinary people

  • Mortgage rates and car loans are tied to long-term Treasury yields. If 10- and 30-year yields keep rising despite Fed cuts, borrowing costs for consumers may not fall the way policymakers (or politicians) promise. That matters for home affordability, corporate investment, and the pace of the economy. (finance.yahoo.com)

  • Fed credibility is monetary gold. If the public and markets lose faith that the Fed will fight inflation when needed — or that it can resist political pressure — the central bank’s ability to anchor expectations weakens. That can make inflation higher and more volatile over time, which is costlier than short-term stimulus. (reuters.com)

The investor dilemma

  • Short-term returns vs. long-term risks: Traders must choose whether to interpret rising yields as a buying opportunity (if growth stays firm) or a warning sign (if fiscal or political pressures push inflation and rates up). Both choices carry real pain if the signal is wrong. (finance.yahoo.com)

  • Pricing the unknown Fed nominee: Markets are trying to price not only macro data but also political risk — how dovish will the next chair be, and how independent? That uncertainty is adding a term premium to bonds that doesn’t move in lockstep with the Fed’s policy path. (reuters.com)

How policymakers and politicians look from here

  • For the Fed: this is a test of independence. Cuts are a tool; credibility is the asset that makes those tools work predictably. If markets perceive cuts as politically driven rather than data-driven, the policy channel frays. (finance.yahoo.com)

  • For the White House: pushing for lower long-term rates via political influence on the Fed is a high-risk play. Even if the administration succeeds in appointing a friendly chair, markets may still demand a premium for perceived fiscal looseness or higher inflation risk, undermining the intended effects. (finance.yahoo.com)

What to watch next

  • Moves in the 10-year and 30-year Treasury yields relative to Fed fund futures pricing. If yields keep diverging from the expected policy path, risk premia or fiscal concerns are probably doing the heavy lifting. (finance.yahoo.com)

  • Inflation data and the Fed’s language. Concrete signs of sticky inflation together with more politically charged rhetoric around appointments will deepen market uncertainty. (reuters.com)

  • Nomination news. Who the White House nominates and how markets and Treasury investors react will shape the credibility story. Early market pushback — as reported in recent investor outreach to the Treasury — already signals concern. (reuters.com)

Some practical thinking for readers

  • If you have a mortgage or plan to borrow, don’t count on big rate relief simply because the Fed is cutting short-term rates. Long-term yields matter. (finance.yahoo.com)

  • For investors: be mindful of duration risk and the possibility that a rising-term premium could pressure long-duration portfolios even as short-term rates fall. Diversification and scenario planning matter more when political risk enters the monetary policy mix. (finance.yahoo.com)

Final thoughts

We’re watching a classic tug-of-war between central-bank tools and market psychology. When bond traders “defy” the Fed, they’re not staging a conspiracy — they’re signalling uncertainty about growth, inflation, fiscal health, and yes, political influence. If the Fed wants the trust that makes policy moves effective, it needs to prove its independence; if politics tries to bend the central bank into short-term aims, the cost will likely show up where it hurts most: in the price of money for everyday Americans.

(finance.yahoo.com)

Sources


Related update: We recently published an article that expands on this topic: read the latest post.


Related update: We recently published an article that expands on this topic: read the latest post.


Related update: We recently published an article that expands on this topic: read the latest post.

Mortgage Rates Fall: New Hope for Buyers | Analysis by Brian Moineau

Mortgage Rates Hit Record Lows: What This Means for Homebuyers

Have you been dreaming of owning a home but felt paralyzed by rising mortgage rates? If so, you might want to sit down for this news: the average rate on a 30-year U.S. mortgage just dropped to its lowest level in over a year. This could be the moment many have been waiting for, making homeownership a more attainable goal. Let’s dive into what this means for prospective buyers and the housing market as a whole.

The Current State of Mortgage Rates

According to a recent article by PBS, the average long-term mortgage rate has seen a notable decline, offering a glimmer of hope for homebuyers who have been navigating a turbulent market. Lower mortgage rates typically stimulate demand for homes, as they reduce monthly payments and increase purchasing power. But what’s behind this sudden decrease, and how might it impact the broader economy?

In 2021 and much of 2022, mortgage rates were on a steep upward trajectory, driven by multiple factors, including inflation and the Federal Reserve’s monetary policies aimed at stabilizing the economy. As rates climbed, many potential buyers were priced out of the market, leading to a noticeable slowdown in home sales. However, recent shifts in economic indicators, including lower inflation rates and a more cautious approach from the Fed, have contributed to the current decline in mortgage rates.

Why This Matters Now

With the easing of rates, first-time homebuyers and those looking to upgrade their living situations may find themselves in a more favorable position. Lower rates mean lower monthly payments and, ultimately, more home for your dollar. But while the current drop is promising, it’s essential to consider other factors at play, such as inventory levels and competition among buyers.

Key Takeaways:

Historic Low Rates: The average 30-year mortgage rate fell to its lowest level in over a year, making homebuying more affordable for many. – Increased Purchasing Power: Lower rates translate to lower monthly payments, which can expand the range of homes within a buyer’s budget. – Market Implications: While lower rates stimulate demand, the overall housing inventory remains a concern, potentially leading to competitive bidding situations. – Future Outlook: The current economic climate suggests that rates may remain low for the foreseeable future, but buyers should stay informed about changes in the market. – Cautious Optimism: While the drop is a positive sign, potential buyers should still proceed with caution and conduct thorough research.

A Moment of Reflection

As mortgage rates dip, the landscape for homebuyers is changing, offering a renewed sense of hope in a market that has felt daunting. However, it’s vital for buyers to remain vigilant and informed about both the opportunities and challenges that lie ahead. Whether you’re a seasoned investor or a first-time buyer, this could be a pivotal moment to take action.

In the end, the housing market is always evolving. Keeping an eye on these trends can empower you to make informed decisions that align with your financial goals.

Sources:

– “Average long-term mortgage rate drops to lowest level in more than a year.” PBS. [Link to PBS article]

Stay tuned for more insights and updates on the housing market as we navigate these exciting changes together!


Related update: We recently published an article that expands on this topic: read the latest post.


Related update: We recently published an article that expands on this topic: read the latest post.


Related update: We recently published an article that expands on this topic: read the latest post.


Related update: We recently published an article that expands on this topic: read the latest post.

Monthly homeownership costs now top $2,000, new data shows – CBS News | Analysis by Brian Moineau

Monthly homeownership costs now top $2,000, new data shows - CBS News | Analysis by Brian Moineau

Title: Navigating the Rising Tide: Homeownership Costs Hit New Highs

In the epic saga of American homeownership, the latest chapter seems to be taking on a rather Dickensian tone: "It was the best of times, it was the worst of times." According to recent data from the Census Bureau, the cost of owning a home in the U.S. has now surged past the $2,000 mark per month. This figure is not just a number; it's a narrative of the challenges and complexities facing millions of Americans today. As we delve into this story, let's keep it light, perhaps with a dash of optimism for those navigating these choppy financial waters.

For many, homeownership is the quintessential American dream—a symbol of stability and success. Yet, as prices rise, that dream can feel increasingly out of reach. The data reveals that both owning and renting are becoming more costly, a one-two punch that is squeezing the financial lifeline of many households. But before we descend into despair, let's take a broader look at the landscape and uncover some silver linings.

In a world that's constantly changing, it's important to remember that the real estate market is no stranger to flux. Previous decades have seen their fair share of ups and downs, and while today's figures may seem daunting, history shows that markets are resilient. The 2008 financial crisis, for example, was a time when homeownership seemed more like a nightmare than a dream, yet it eventually rebounded, albeit with significant lessons learned. Today's challenges, though formidable, are navigable with the right knowledge and a bit of patience.

This surge in costs dovetails with broader economic trends. Inflation has been a hot topic globally, with everything from eggs to energy seeing price hikes. The Federal Reserve's interest rate hikes, aimed at curbing inflation, have inadvertently made borrowing more expensive, impacting mortgage rates and, by extension, monthly payments. It's a classic case of economic cause and effect, and one that underscores the interconnectedness of global financial systems.

Interestingly, as Americans grapple with these rising costs, the trend isn't isolated to the U.S. Across the pond, the UK housing market is also experiencing its own set of challenges, with prices soaring and affordability becoming a growing concern. It's a global issue, and one that signals a need for innovative solutions and policy interventions.

But let's not lose sight of the resilience and creativity of the American spirit. In the face of rising costs, many are finding ways to adapt and thrive. The rise of remote work, for example, has allowed individuals to rethink their living situations, often opting for more affordable areas without the burden of a daily commute. Additionally, the tiny house movement and co-housing communities are gaining traction as alternative solutions to traditional homeownership.

As we ponder these developments, it's crucial to consider the role of technology in shaping the future of real estate. From virtual home tours to blockchain transactions, technology is revolutionizing how we buy, sell, and even think about homes. These innovations have the potential to make the market more accessible and efficient, offering a glimmer of hope amid rising costs.

In the grand tapestry of life, housing is but one thread, albeit an important one. As we navigate these financial waters, let's do so with a spirit of curiosity, openness, and perhaps even a bit of humor. After all, every challenge presents an opportunity for growth and reinvention.

Final Thought:

While the costs of homeownership may be climbing, so too is our capacity for innovation and adaptation. By embracing change and exploring new avenues, we can turn these challenges into opportunities. Remember, even in the face of rising tides, it's the journey—and the stories we create along the way—that truly matter.

Read more about AI in Business

Read more about Latest Sports Trends

Read more about Technology Innovations

Fed Gets Green Light for Interest Rate Cuts as Unemployment Rate Jumps to 4-Year High – Realtor.com | Analysis by Brian Moineau

Fed Gets Green Light for Interest Rate Cuts as Unemployment Rate Jumps to 4-Year High - Realtor.com | Analysis by Brian Moineau

Blog Post: The Fed’s Interest Rate Tango: A Dance with the Economy

In a world where economic indicators often feel as unpredictable as a game of Jenga on a shaky table, the recent news that the Federal Reserve has been given the green light for interest rate cuts might just be the stability we need—or at least a strategic move in the economic dance. According to Realtor.com, the unemployment rate has jumped to a four-year high, prompting the Fed to consider cutting interest rates in response. Let's unpack what this means, not just for the U.S. economy but for your wallet and perhaps even your dream of owning that cozy cottage by the lake.

The Fed’s Balancing Act

The Federal Reserve has always played a critical role in maintaining economic stability. By adjusting interest rates, the Fed can either cool down an overheating economy or give it a much-needed boost. With unemployment on the rise, this is an opportune moment for the Fed to step in and cut rates. Lower interest rates mean cheaper borrowing costs, which can stimulate spending by consumers and businesses alike. This is akin to giving the economy a shot of espresso—just what it might need to liven up!

However, this isn’t a decision made lightly. Jerome Powell, the Fed Chair, and his team must weigh the potential risks of cutting rates. Lower rates could lead to increased borrowing, which is great for economic growth, but it could also inflate asset bubbles. It’s a delicate dance, where one wrong move could send the economy spinning off the floor.

Global Economic Connections

The decision to cut rates doesn’t occur in isolation. Globally, economies are interlinked in a complex web of trade and finance. Recently, the International Monetary Fund (IMF) lowered its global growth forecasts, citing issues such as trade tensions and geopolitical uncertainties. A move by the Fed to lower rates could have ripple effects, influencing other central banks to consider similar measures to keep their economies competitive and prevent capital outflows.

Moreover, with the ongoing buzz around climate change and sustainability, it’s interesting to note how economic policies are increasingly factoring in environmental impacts. Investment in green technologies is becoming a priority, and lower interest rates could provide the necessary capital boost for these eco-friendly ventures.

The Real Estate Angle

For those eyeing the real estate market, this news comes as a mixed bag. On one hand, lower rates could make mortgages more affordable, a boon for homebuyers. Realtor.com’s insights suggest that this could invigorate the housing market, which has been showing signs of cooling off. On the other hand, if unemployment continues to rise, consumer confidence might wane, impacting the real estate sector negatively.

Final Thoughts

As the Fed prepares to potentially tweak interest rates, it’s crucial to remain informed and pragmatic about the implications. While lower rates could indeed stimulate economic activity, they also come with their own set of challenges. For the average person, this might be a good time to reassess financial plans, whether it’s locking in a mortgage rate or considering investments.

In the grand scheme of things, economic policies are like a complex waltz—requiring precision, timing, and a bit of flair. The Fed’s decision to cut rates will be just one move in this ongoing dance, one that affects not just Wall Street but Main Street too.

As we watch this economic choreography unfold, let’s hope it leads to a harmonious outcome for all. After all, in the dance of economics, every step counts.

Read more about AI in Business

Read more about Latest Sports Trends

Read more about Technology Innovations