
Nob Hill Opulence: Patty Hearst’s | Analysis by Brian Moineau

TL;DR

  • A $5.2M San Francisco condo at 1001 California Street, No. 7—Patty Hearst’s post‑bail perch—just hit the market with a 2,980‑sq‑ft, full‑floor plan in a 1914 Houghton Sawyer Beaux‑Arts building on Nob Hill. [1]
  • The premium is explicit: ~$1,745/sq ft here vs. ~ $1,300/sq ft in Nob Hill and ~ $1,090 citywide, roughly +34% and +60% respectively. Scarcity and provenance still price in. [1][6][5]
  • Carrying costs bite: with 20% down and a jumbo ~6.78% (Aug 24, 2026), plus $5,432 HOA and a 1.18268325% property tax rate, the all‑in before insurance lands near $37.6K/month—pushing buyers toward all‑cash or rate‑insensitive profiles. [4][2][3]

What the source said

SFGATE profiles 1001 California St., No. 7, a full‑floor, 2,980‑sq‑ft penthouse in a 1914 Houghton Sawyer Beaux‑Arts building on Nob Hill, listed at $5.2 million with Sotheby’s agents Mary Lou Castellanos and Grazia Bennett. The article notes the arched stained‑glass skylight, paneled library, formal dining room, marble hearth, and a terrace off the primary suite, plus proximity to the Fairmont Hotel and Huntington Park on California Street. The story highlights that Patty Hearst lived here with her parents in the 1970s after release on bail, and that the unit last sold for $3.5 million in 2010. The listing shows HOA dues of $5,432/month and parking as “on site – monthly fee,” not deeded. [1][2]

What others are missing

  • Transfer tax changes the net math: San Francisco imposes 2.25% Real Property Transfer Tax on $5M–$10M deals, which is about $117,000 on $5.2M; sellers usually pay in SF custom, but buyers sometimes negotiate splits in thin markets. [8]
  • Non‑deeded parking is a variable OPEX line, not an asset: Nob Hill garages around California Street list monthly rates in the ~$400–$650 range in 2026, and operators can raise rates annually. [2][10]
  • Federal tax caps dull the “write‑off” story: the TCJA’s $750,000 mortgage interest cap (2017) and the $10,000 SALT cap mean a financed buyer with a ~$4.16M jumbo deducts only a fraction of first‑year interest; the rest is fully out‑of‑pocket. [9]

Why it matters

The buyer pool here is a narrow slice: households indifferent to a ~6.78% jumbo, willing to absorb $5,432 monthly HOA dues, and prioritizing 1914 Beaux‑Arts fabric and Nob Hill cachet over 2015‑era tower amenities at Lumina or 2008‑era One Rincon Hill. That cohort exists but is smaller than the 2010s South Beach/SoMa set. [2][4]

On the sell side, the HOA at 1001 California and the Sotheby’s team are testing whether Hearst‑era lore and a full‑floor plan can clear at $5.2M while citywide condo metrics still reset. If it trades near ask, it affirms that a handful of pedigreed addresses sit above the broader San Francisco condo baseline; if it lingers, it underlines how financing costs and dues now gate even blue‑chip corners opposite the Fairmont. [1][5][6]

Original analysis

Back‑of‑envelope: all‑in monthly for a financed buyer

  • Assumptions: 20% down on $5.2M → $1.04M down; $4.16M loan; jumbo 30‑year fixed ≈ 6.78% (Aug 24, 2026); SF FY25–26 property tax rate 1.18268325%; HOA $5,432/month. [4][3][2]
  • Mortgage P&I: r = 0.0678/12; n = 360; P&I = 4,160,000 × [r(1+r)^n]/[(1+r)^n − 1] ≈ $27,065/month (calculator cross‑check). [7]
  • Property tax: $5,200,000 × 1.18268325% ÷ 12 ≈ $5,125/month. [3]
  • HOA: $5,432/month. [2]
  • Total before insurance/utilities: ≈ $27,065 + $5,125 + $5,432 = ~$37,622/month. [2][3][4][7]

What that premium buys

  • Price per square foot: $5,200,000 ÷ 2,980 ≈ $1,745/sq ft. [1]
  • Benchmarks: Nob Hill median ≈ $1,300/sq ft; citywide ≈ $1,090/sq ft; premium ≈ +34% vs. Nob Hill and ≈ +60% vs. citywide. [6][5]

Contrarian read

  • Consensus: “Trophy prewar Nob Hill is insulated; these always move.”
  • Counter: Two frictions cap velocity. First, the ~$37.6K/month pre‑insurance nut filters to cash or very low‑LTV buyers. Second, dues‑heavy historic full‑service stock competes with 2014–2016 amenity towers (valet, gyms, pools) offering similar all‑in monthlies on smaller footprints, often with deeded parking; here, parking is “on site – monthly fee,” not deeded. [2][4][5][6]

2×2: The SF luxury‑condo buyer matrix

  • Axes: A) Fabric (Historic character ←→ Contemporary spec) and B) Operating Profile (Lean HOA ←→ Full‑service HOA).
    • Historic + Full‑service (this unit): Buyer values provenance and staffing over dues drag; cash or low‑LTV; long‑hold bias.
    • Historic + Lean: Boutique walk‑ups with lower staff overhead; fewer services, lower dues.
    • Contemporary + Full‑service: Amenity towers (valet, gym, pool; e.g., 2015 Lumina); convenience at higher dues.
    • Contemporary + Lean: Newer mid‑rises without 24/7 staff; broader financed buyer base.

Named‑stakeholder breakdown

  • 1001 California HOA: $5,432/month equals ≈ $1.82/sq ft, or ≈ $65,184/year from this unit alone—stabilizing reserves and services; a near‑ask sale helps future refis and capital planning. [2]
  • Sotheby’s International Realty (Castellanos, Bennett): The pitch leans on Sawyer’s façade, Patty Hearst’s 1970s chapter, and Nob Hill’s “fourth corner” across from the Fairmont and Pacific‑Union Club, because pure “value per foot” comps won’t carry it. [1][2]
  • Buyer profile: Cash or ultra‑low‑LTV households, often with multiple homes, seeking boardroom‑grade reception rooms; broader SF condo data show recovery pockets, but taste and overhead tolerance will dominate this micro‑trade. [5][6]

Historical analogue

  • During the 1991 recession and again after the 2001 dot‑com bust, Pacific Heights and Nob Hill full‑floor prewar resales saw thin volume but resilient premiums due to finite sets (specific architects, single‑floor layouts, protected view corridors). This 1914 Sawyer top floor fits that scarcity script.

What to watch next

  1. Status by November 30, 2026: either under contract or price‑reduced by ≥5% from $5.2M; binary check on whether the market clears the ask.
  2. Closing by February 28, 2027 at $4.7M–$5.3M vs. a miss outside that band; this brackets a ±6% tolerance around ask.
  3. Days on Market surpasses 120 days by December 31, 2026 if not in contract; tests the “trophy insulation” thesis against rate‑driven inertia.

Sources

[1] SFGATE — Listing feature on 1001 California St., No. 7; confirms 2,980 sq ft, $5.2M ask, 1914 build, Patty Hearst history, and prior sale.
What this contributes: Core property facts, provenance, and sale history.

[2] Sotheby’s International Realty (listing for 1001 California St., No. 7) — Marketing brochure and MLS details, including $5,432/month HOA, parking as “on site – monthly fee,” and agent names.
What this contributes: Dues, parking structure, and agent of record.

[3] City and County of San Francisco Treasurer & Tax Collector — FY 2025–26 secured property tax rate (1.18268325%).
What this contributes: Official property tax rate used in carrying‑cost math.

[4] Mortgage News Daily — Jumbo 30‑year fixed average around 6.78% as of August 24, 2026.
What this contributes: Rate assumption for the mortgage calculation.

[5] Redfin Data Center — San Francisco citywide median price per square foot (~$1,090, 2026 YTD).
What this contributes: Citywide pricing benchmark.

[6] Redfin Neighborhoods (Nob Hill) — Neighborhood median price per square foot (~$1,300).
What this contributes: Localized comp baseline.

[7] Bankrate Mortgage Calculator — Standard amortization model used to reproduce the ~$27,065/month P&I on $4.16M at ~6.78% over 30 years.
What this contributes: Methodology for payment math.

[8] City and County of San Francisco — Real Property Transfer Tax Rates (2.25% for $5M–$10M).
What this contributes: Closing‑cost input relevant to net proceeds and negotiations.

[9] IRS Publication 936 (Home Mortgage Interest Deduction) — $750,000 cap enacted by the Tax Cuts and Jobs Act (2017) and SALT deduction limits.
What this contributes: Tax‑treatment constraints on high‑balance mortgages.

[10] SpotHero (San Francisco monthly parking listings, Nob Hill/California St. corridor) — Typical 2026 monthly rates in the ~$400–$650 range.
What this contributes: Operating cost proxy for non‑deeded parking.


Related update: We recently published an article that expands on this topic: read the latest post.

Related update: We recently published an article that expands on this topic: read the latest post.

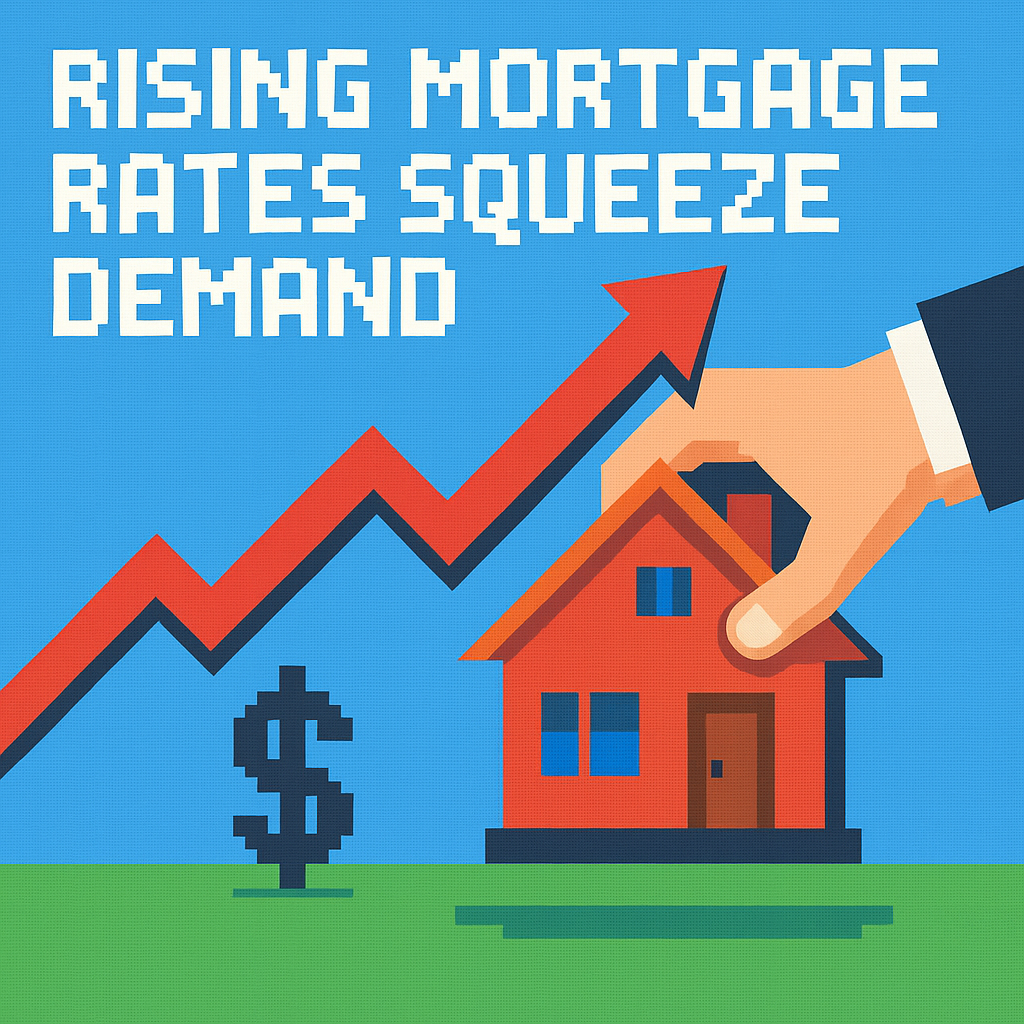
Rising Mortgage Rates Squeeze Demand | Analysis by Brian Moineau

TL;DR

  • Mortgage rates climbed to a one-year high last week and immediately dented demand; applications fell 2.9% week over week and 5% year over year, with refinance activity down 9% versus 2025 [1].
  • The rate spike is tethered to energy headlines: oil’s drop early this week briefly pulled yields and mortgage rates lower again, underscoring how the Iran war shock is dictating borrowing costs as much as the Fed is [1][2][3].
  • Prices aren’t cracking: Redfin says the median sale price sat about $800 below its all-time high in mid-July near $408,804, so higher mortgage rates are squeezing affordability rather than forcing broad price declines [4].

What the source said

CNBC reports mortgage demand slumped as the average contract rate for a 30‑year fixed with conforming balances rose to 6.81% (points: 0.65, from 0.69) after the July FOMC meeting, with total applications down 2.9% week to week and 5% year over year [1]. Refinances dropped 2% on the week and 9% year over year, while purchase apps fell 4% week to week and 3% year over year, according to the MBA print carried by CNBC [1]. Mortgage News Daily observed rates eased to two‑week lows at the start of this week as Iran‑war rhetoric cooled and oil slipped, helping bonds and lender pricing [5]. MBA’s Mike Fratantoni said higher mortgage rates “weakened overall demand,” a comment carried in the August 5 CNBC write‑up [1].

Why it matters

The real stakeholders aren’t “homebuyers” in the abstract—they’re first‑timers in Phoenix or Tampa sizing their budgets against Redfin’s $408,804 national median, move‑up owners who locked ~3% mortgages in 2020–2021 per Freddie Mac archives, and lenders like Rocket Mortgage that live on daily rate sheets [4][6]. When mortgage rates pop on geopolitical oil scares, buyers don’t just delay—they lose purchasing power while list prices hold near records, and that redirects demand toward builder incentives, smaller homes, FHA, or the sidelines [1][4].

For the industry, the stakes extend past a slow August 2026. With Freddie Mac’s benchmark 30‑year rate printing 6.69% on August 6 and Redfin’s median price hovering just under peak, the gap between wages and monthly payments is widening again into Q3 2026 [2][4]. If the oil‑driven rate premium persists into fall, pipelines at lenders and agents thin out while builders like D.R. Horton lean harder on buydowns and credits to keep model‑home traffic converting [2][4].

Original analysis

Back‑of‑envelope: the payment punch

  • Assumption: national median sale price $408,804 in mid‑July (Redfin). With 20% down, loan amount ≈ $327,043 [4].
  • Payment at 6.81% (30‑yr): ≈ $2,134/month P&I (standard amortization on $327,043).
  • Payment at 6.49% (early‑July average per PMMS/MND): ≈ $2,065/month [5][6].
  • Delta from 6.49% to 6.81%: ≈ $69/month, or ~$828/year—enough to tip debt‑to‑income approvals at the margin [5][6].

This math explains why purchase apps retrench when headlines swing rates; a $69/month move isn’t abstract to a first‑time buyer near DTI limits, and it arrives faster than wages adjust or sellers cut list prices [1][4].

Contrarian read

  • Consensus: “Higher mortgage rates will finally force home prices down.”
  • My case: In 2026, higher rates are depressing transactions more than prices because inventory remains constrained and demand is elastic to payments, not sticker price; Redfin’s July read shows the median sale price about $800 below the all‑time high even as pending sales softened when the daily average rate flirted with a one‑year high near 6.85% in late July [4][5].

The more relevant lever isn’t the sticker; it’s the financing bundle. MBA’s survey shows average points fell to 0.65 from 0.69 even as the contract rate hit 6.81%, signaling lenders adjusted fees to keep APRs competitive when volatility spiked [1].

Historical analogue: 2013’s taper‑tantrum, updated

In mid‑2013, mortgage rates jumped from roughly 3.6% to 4.3–4.5% after the Fed’s taper talk; purchases cooled and refinances slumped, but prices advanced into year‑end, as the St. Louis Fed documented in a 2017 review [6][7]. Today rhymes—with a twist: the catalyst isn’t QE chatter; it’s geopolitics via oil, as seen when rates spiked into late July 2026, Freddie Mac’s weekly survey clocked 6.69% on August 6, then eased as crude fell on Iran de‑escalation headlines [2][3][5]. Expect choppy volumes and sticky prices again, not a straight‑line correction into Q4 2026 [2][4].

2x2: rate level vs. inventory tightness

  • High rates + tight inventory (July–August 2026): Low transactions, firm prices; builders deploy buydowns, and portals like Zillow/Redfin see steady traffic but weaker conversion [4][5].
  • High rates + loose inventory: Prices soften; 2018‑style discounts reappear; lock desks prioritize fee cuts over rate cuts to keep APRs steady [6].
  • Low rates + tight inventory: Bidding resurges; lenders refocus on capacity; refi mini‑cycle appears in cash‑out and consolidation cohorts near sub‑6.5% [5][6].
  • Low rates + loose inventory: Broad price discovery; sellers capitulate faster; volumes and prices both stabilize on affordability relief [6].

Named‑stakeholder breakdown

  • Rocket Mortgage, UWM, Mr. Cooper: Volatility is the business; headline rates near 6.85% in late July forced fee tinkering, while any sustained drift toward the mid‑6s could spark a small refi mini‑cycle in cash‑outs and debt consolidation [1][5].
  • D.R. Horton, Lennar, Pulte: Builders can manufacture “price” via 2‑1 buydowns and closing credits; oil‑driven dips in rates create brief booking windows, so sales teams will lean into lock‑and‑shop when Iran headlines soften [3][5].
  • Zillow, Redfin: With the median price near peak and new‑listing flow thin, site traffic holds while conversion hinges on payments; Redfin’s tracker shows pending sales move almost tick‑for‑tick with rate changes [4][5].

What others are missing

The oil‑to‑mortgage channel isn’t only wiggling the 10‑year; it’s reshaping the fee stack at the lock desk. MBA’s survey shows points fell to 0.65 even as the rate hit 6.81%, and Mortgage News Daily logged rapid lender repricing when Iran headlines eased and oil slipped, which means affordability now turns on a bundle—rate, points, and concessions—optimized (or not) against energy shocks [1][5]. Coverage that fixates on the headline rate misses those competitive tactics and the approval impact when lenders swap small rate moves for fee changes during intraday rallies [1][5].

What to watch next

  1. By September 30, 2026, Freddie Mac’s weekly 30‑year average prints below 6.5% at least once if Brent holds under $85/barrel for two consecutive weeks; otherwise it does not, linking crude to rate relief [2][3].
  2. By Q4 2026, the national median sale price sets a new high even if purchase apps remain below 2025 levels, confirming that volume—not price—is the primary shock absorber in this cycle [1][4].
  3. By October 31, 2026, at least two top‑10 builders report buydowns on 60%+ of Q3 closings in earnings commentary or 10‑Qs, reflecting payment‑first buyer behavior.

My take

I don’t buy the “rates up, prices must fall” story for H2 2026. Mortgage rates are being yanked by oil headlines as much as by the Fed, so every de‑escalation is a tradable window for locks, and every flare‑up steals approvals from the edge [2][3][5]. If you run a sales desk at a lender or a brokerage, build playbooks around volatility, not levels: capture locks on dips, pivot borrowers to lower‑point structures when oil pops, and borrow builder‑style incentives where you can [1][4][5]. The winners this year will be the fastest optimizers of payment per dollar, not the boldest price cutters [1][2][4][5].

Sources

  1. Mortgage rates hit their highest level in over a year, causing demand to drop below year-ago levels — CNBC (https://www.cnbc.com/2026/08/05/mortgage-rates-hit-their-highest-level-in-over-a-year.html) — MBA application data, 30‑year contract rate at 6.81%, and points shift signal fee tactics.
  2. Mortgage rates rise for 5th straight week, hitting levels not seen since 2025 for 2nd week in a row — AP (https://apnews.com/article/42d8262fb00b904fd7c2b906751610d7) — Freddie Mac’s 30‑year fixed at 6.69% on Aug. 6 and yield/inflation context.
  3. Oil prices drop after Trump orders US forces to hold off on new strikes against Iran — AP (https://apnews.com/article/194ab3d3130bb44de445cf3d05954beb) — Link between de‑escalation headlines and a crude drop that eased yields.
  4. Pending Home Sales Slip Amid Stubbornly High Housing Costs, Economic Uncertainty — Redfin (https://www.redfin.com/news/press-releases/pending-home-sales-slip-amid-stubbornly-high-housing-costs-economic-uncertainty/) — Median sale price near $408,804 and sensitivity of pending sales to weekly rate moves.
  5. Mortgage Rates Roughly Unchanged Versus Friday’s Lows — Mortgage News Daily (https://www.mortgagenewsdaily.com/markets/mortgage-rates-07272026) — Late‑July daily rate highs near 6.85% and commentary on lender repricing vs. oil/Iran news.
  6. Mortgage rates and affordability (PMMS background and archives) — Freddie Mac (https://www.freddiemac.com/pmms/pmms_archives) — Historical perspective on 2020–2021 sub‑3% rates and early‑July 2026 averages for comparisons.
  7. Could Housing Markets Face Another “Taper Tantrum” Moment? — St. Louis Fed (https://www.stlouisfed.org/on-the-economy/2017/march/housing-markets-face-taper-tantrum-moment) — 2013 analogue showing rate spikes slowed activity without a full‑blown housing slump.

Betting on a Hot Economy to Win Midterms | Analysis by Brian Moineau

Running the Economy Hot: Politics, AI and the Bet for a Midterm Bounce

The White House is openly gambling that a hotter economy will translate into happier voters. Picture this: bigger tax refunds hitting bank accounts this spring, investment incentives nudging companies to spend, a friendlier regulatory climate—and a steady drumbeat about AI-driven productivity keeping inflation from erupting. It’s a full-court press aimed at lifting Republican prospects in November’s congressional elections.

Below I unpack what the administration is promising, why economists are split, and what voters and markets should watch as the calendar moves toward the midterms.

Why the administration thinks this will work

  • The policy centerpiece is sweeping tax changes that increase refunds and lower tax bills for many households and businesses—money the White House says will fuel consumer spending and business investment.
  • Officials are banking on three reinforcing forces: fiscal stimulus (tax refunds and incentives), looser regulation, and an expected easing of interest rates from the Federal Reserve.
  • Crucially, they argue that productivity gains from broader AI adoption will expand supply and output, allowing wages and growth to rise without rekindling persistent inflation.

This is not subtle messaging. Administration officials and allies have framed the near-term goal as “running the economy hot” to deliver strong GDP numbers before voters cast ballots.

What’s actually in motion (and the timing)

  • Tax refunds: New or extended provisions in recent tax legislation mean many filers will see larger refunds this filing season, which typically peaks from February through April. That timing could create visible short-term boosts in consumer spending.
  • Business incentives: Provisions that accelerate write-offs and expand research & development credits are designed to push companies to invest now rather than later.
  • Monetary policy hopes: The White House is counting on the Fed to cut rates in 2026, lowering borrowing costs and amplifying fiscal stimulus. That’s a political — and calendar-sensitive — wish.
  • AI productivity argument: Officials point to faster productivity in IT and knowledge sectors as proof that AI can raise output without a proportional rise in prices.

The economist’s dilemma

  • Stimulus composition matters. Tax cuts skewed toward higher earners and corporate incentives can increase GDP without producing the same marginal consumption boost as relief targeted at lower-income households. Higher-income recipients tend to save or invest a larger share.
  • Timing and behavioral responses are uncertain. Many households carry elevated credit-card balances and might use refunds to pay debt rather than spend. Corporations may also delay investment if they see demand or policy risks.
  • Inflation and the Fed. If growth re-accelerates faster than expected and inflation moves up, the Fed could tighten—undoing the administration’s hoped-for cycle of rate cuts.
  • Tariffs, immigration stance and regulatory rollbacks could blunt gains. Trade barriers and policies that strain labor supply may raise costs and constrain growth even as tax-driven demand rises.

Who wins — and who might not

  • Potential winners: Homeowners, asset-holders and firms positioned to benefit from accelerated investment or deregulation. Voters who receive larger refunds and feel immediate relief may reward incumbents.
  • Potential losers: Younger, price-sensitive renters facing high housing costs; lower-income households that don’t see proportional benefit; and broader wage earners if inflation returns or housing and credit costs stay elevated.
  • Political payoff depends on perception: Voters tend to reward perceivable personal economic gain. A headline GDP beat helps, but pocketbook effects (paychecks, refunds, mortgage rates) often matter more.

Signals to watch between now and November

  • IRS refund flows and consumer spending figures (Feb–Apr): are refunds getting spent or used to pay down debt?
  • Job growth and wage trends: sustained wage gains would bolster the “hot economy” narrative.
  • Core inflation and Fed communications: any sign inflation is re-accelerating could prompt a policy pivot.
  • Corporate capex announcements: are firms actually accelerating investment on the incentives?
  • Housing and credit indicators: mortgage rates, home prices and consumer credit trends will shape broader sentiment.

Quick takeaways

  • The administration is pursuing a time-sensitive strategy: fiscal boosts, deregulatory moves and a narrative about AI productivity to produce a visible economic lift before midterms.
  • The policy mix could produce a short-term growth bump, but whether that translates into durable gains or voter gratitude is uncertain.
  • The Federal Reserve and household responses (spending vs. debt repayment) are the two wildcards that will determine if “running hot” helps or backfires.

My take

This is a high-stakes political experiment wrapped in economic policy. The mechanics are plausible—a tax-season boost, combined with business incentives, can push GDP higher in the short run. But economics is full of second acts: who receives the gains, how they use them, and how monetary policy reacts. If AI does meaningfully raise productivity and the Fed leans dovish as hoped, the White House narrative could be vindicated. If inflation surprises to the upside or refunds flow into debt repayment, the engine sputters—and the political returns may fall short.

Sources


Related update: We recently published an article that expands on this topic: read the latest post.


Related update: We recently published an article that expands on this topic: read the latest post.


Related update: We recently published an article that expands on this topic: read the latest post.

DOJ Moves to Cut Real Estate Commissions | Analysis by Brian Moineau

Why the DOJ’s New Statement on Real-Estate Competition Matters More Than Your Agent’s Business Card

The Department of Justice just stepped into a corner of American life that affects nearly everyone who ever thinks about owning a home: how real-estate brokers compete — and how much that competition (or lack of it) costs buyers and sellers. The Antitrust Division filed a statement of interest on December 19, 2025, backing claims that industry practices and trade-association rules have suppressed competition and helped keep U.S. broker commissions stubbornly high. That legal posture may seem arcane, but its consequences ripple across home prices, agent business models, and how homes are marketed.

Why this is catching people’s attention

  • Buying a home is the largest purchase most Americans make. Small percentage points in commission structures can equal thousands of dollars.
  • U.S. broker commissions have long lingered around 5–6% — roughly double or triple what buyers pay in many other developed countries.
  • The DOJ is no longer sitting on the sidelines. Its statement of interest signals regulators are prepared to treat trade-association rules and brokerage practices as potential antitrust problems.

If you follow housing headlines, this is part of a steady drumbeat: lawsuits, regulatory probes, and court rulings over the last several years have put the National Association of Realtors (NAR), MLS rules, and various local listing practices under sustained scrutiny. The DOJ’s filing doesn’t decide a case — but it frames how the courts and the public should view the competitive stakes.

What the DOJ filing says (plain English)

  • The Antitrust Division told a federal court that competition among real-estate brokerages is “critical” for protecting homebuyers.
  • It emphasized that trade-association rules can — and should — be subject to antitrust scrutiny when they have the effect of limiting competition (for example, if they facilitate price-setting or discourage lower-cost business models).
  • The filing clarifies that such association rules aren’t automatically exempt from horizontal price-fixing rules under the Sherman Act.

Put another way: the DOJ is reminding courts that rules made by associations of businesses — even long-standing industry norms — can be unlawful when they restrain competition.

The backstory you should know

  • Plaintiffs and plaintiffs’ lawyers have sued brokerages and MLS operators in multiple high-profile cases alleging that sellers have been pressured (directly or indirectly) to pay buyer-agent commissions, keeping listing commissions artificially high.
  • NAR faced a landmark $1.8 billion jury verdict in earlier litigation, followed by proposed settlements and continued investigations. The DOJ has previously criticized some proposed settlements as inadequate and has even withdrawn support when it believed consumer protections were insufficient.
  • Courts have reopened and re-examined the DOJ’s authority to investigate NAR and related policies, and regulators (including the FTC in earlier years) have published studies on competition in the brokerage industry.
  • Specific rules such as the “Clear Cooperation Policy” and MLS compensation disclosure practices have been lightning rods — regulators worry these can limit alternative business models and private/alternative listing platforms.

All of this reflects an ongoing shake-up: traditional ways of buying and selling homes are colliding with new platforms, discount brokerages, and regulators pushing for clearer competition.

Who wins and who loses if the DOJ’s view carries the day

  • Winners

    • Consumers (potentially): stronger competition could mean lower effective commissions, better transparency, and more choice in how to buy/sell homes.
    • Alternative brokerages and technology platforms: if association rules that favor legacy models are curtailed, disruptive or low-cost models get room to grow.
    • Innovators who offer à la carte services or flat-fee models.
  • Losers

    • Incumbent brokers and large brokerages that rely on the status quo and network effects in MLS systems.
    • Trade associations or cooperative rules that restrict how members offer or disclose compensation.

Expect incumbents to push back — through legal defenses, lobbying, and tweaking business practices — while challengers and consumer advocates press for change.

What this could mean for buyers, sellers, and agents

  • Buyers and sellers might see more transparent commission arrangements and increased availability of low-fee alternatives, especially in competitive markets.
  • Sellers could gain more explicit control over how their listings are marketed and how buyer-agent compensation is offered or disclosed.
  • Agents may have to adapt by differentiating services (rather than relying on commission norms), experimenting with pricing models, or specializing more to justify higher fees.

Change won’t be instantaneous: court cases move slowly, and industry practices are embedded. But the DOJ’s statement accelerates a momentum that’s been building for years.

Things to watch next

  • How courts treat the DOJ’s statement of interest in the Davis et al. v. Hanna Holdings case and related litigation.
  • Any changes to MLS rules or to NAR policies negotiated as part of litigation or settlement agreements.
  • Legislative or regulatory steps at the state or federal level aimed at commission disclosure, MLS practices, or antitrust enforcement in real estate.
  • Market responses: will brokerages voluntarily offer new pricing structures, or will they double down on traditional models?

Key takeaways

  • The DOJ is explicitly framing real-estate brokerage rules as an antitrust issue — not a marginal industry debate.
  • Longstanding commission norms in the U.S. are a major target because they have substantial consumer cost implications.
  • If courts and regulators press reforms, consumers could gain more pricing options and transparency; incumbents may see their business models disrupted.

My take

This is an important pivot in how we think about housing-market fairness. Real-estate brokerage hasn’t been treated like other competitive markets in part because tradition and local practices insulated it. The DOJ’s recent posture signals that tradition alone won’t defend practices that suppress competition or keep consumers paying more than they otherwise might. For buyers and sellers, the promise is more choice and clearer pricing. For agents, the challenge is to prove value beyond a commission number — or adapt their pricing.

The change won’t be painless; entrenched systems and powerful networks don’t unwind quickly. But a marketplace where brokers compete on price, service quality, and transparency — rather than on opaque norms — is better for most consumers. That’s worth watching, and potentially worth celebrating.

Sources

How a Fed Cut Lowers $600K Mortgage | Analysis by Brian Moineau

How much cheaper does a $600,000 mortgage feel after the Fed’s December rate cut?

You probably felt it in your inbox and on the housing feeds: lenders nudging rates down, refinance calculators lighting up, and that nagging “what-if-I-wait” question growing louder. The Federal Reserve’s December 2025 rate cut didn’t instantly rewrite mortgage math — but it did make a noticeable dent in monthly payments for many buyers. Let’s walk through what that means if you’re looking at a $600,000 mortgage, why the change matters, and how to think about timing.

Why a Fed cut matters (even if mortgage rates don’t follow directly)

  • The Fed sets the federal funds rate, which affects short-term borrowing costs and market sentiment.
  • Mortgage rates are driven by longer-term Treasury yields, lender risk, and market expectations — not the Fed rate itself.
  • Still, Fed cuts often push Treasury yields lower and ease financial conditions, which tends to put downward pressure on mortgage rates over time.

So the Fed’s move is more like turning down the thermostat in a crowded room: it won’t immediately cool everything to the same temperature, but it changes the environment and expectations — and lenders respond.

What the numbers look like now

Using the rate levels reported after the Fed’s December 2025 cut, today’s average mortgage rates translate into the following monthly principal-and-interest payments on a $600,000 loan:

  • 30‑year fixed at 5.99% → $3,593.45 per month. (cbsnews.com)
  • 15‑year fixed at 5.37% → $4,861.21 per month. (cbsnews.com)

To give those numbers some context, at the start of 2025 the averages were much higher:

  • 30‑year fixed at 7.04% → $4,007.95 per month. (cbsnews.com)
  • 15‑year fixed at 6.27% → $5,151.08 per month. (cbsnews.com)

That gap means a 30‑year borrower locking today would pay about $415 less per month (roughly $4,974 a year) compared with January 2025 rates — real breathing room on a sizeable mortgage. (cbsnews.com)

How meaningful is that change?

  • Monthly relief: Several hundred dollars a month can affect affordability, debt-to-income ratios, and the size of homes buyers can realistically consider.
  • Long-run savings: Lower interest rates over 30 years compound into tens of thousands of dollars in interest savings.
  • Market behavior: Easier rates can nudge more sellers to list homes and more buyers to act, which can tighten inventory and push prices up — offsetting some of the rate benefit in hot markets.

Remember: averages reported by Freddie Mac and rate trackers reflect the national picture; your local rate will depend on your credit score, down payment, lender fees, loan type, and whether your loan is conforming or jumbo. (apnews.com)

Should you lock now or wait for 2026?

  • Expectation vs. reality: Markets are pricing in more easing but not a guaranteed plunge. Some economists expect one or a few modest additional cuts in 2026; lenders may already price that in.
  • Opportunity cost: Waiting can save money if rates fall more — but it also risks higher home prices, increased competition, and months of uncertainty.
  • Practical rule: If you’ve found a home you can afford comfortably at today’s payments, locking secures your payment and removes rate risk. If you’re flexible and prefer to shop rates, be ready to act quickly if a clear downtrend appears.

The CBS analysis notes that many lenders have already baked in expectations for future cuts, meaning additional Fed easing might have a muted direct effect on posted mortgage rates; refinancing later is often the path buyers take if rates fall further. (cbsnews.com)

A few tactical tips

  • Shop widely: Small differences in points and fees change effective rates. Get multiple lender quotes and compare APRs.
  • Consider loan types: A 15‑year will save interest but cost more monthly; ARMs may help short-term buyers but carry re‑rate risk.
  • Improve your profile: Better credit, a larger down payment, and lower debt-to-income can unlock lower quoting rates.
  • Think refinance, not regret: If you buy now and rates fall materially, you can usually refinance — though you’ll pay closing costs and have to weigh break-even timing.

What I’m watching next

  • Treasury yields: These have the biggest sway on longer-term mortgage pricing.
  • Inflation data and job reports: Stronger-than-expected numbers can push yields (and mortgage rates) back up.
  • Fed guidance: Any explicit signal about the pace of future cuts or balance-sheet steps will move markets.

My take

The Fed’s December cut was welcome news for buyers and borrowers — it translated into meaningful monthly savings versus the painful first half of 2025. But the mortgage market doesn’t move in lockstep with Fed announcements, and the difference between “good enough” and “perfect” often comes down to personal circumstances. If the monthly payment at today’s rates fits your budget and matches your life plan, there’s solid logic to locking and moving forward. If you decide to wait for lower rates, do it with a clear timeline and contingency plan.

Sources


Related update: We recently published an article that expands on this topic: read the latest post.

Mortgage Rates Fall: New Hope for Buyers | Analysis by Brian Moineau

Mortgage Rates Hit Record Lows: What This Means for Homebuyers

Have you been dreaming of owning a home but felt paralyzed by rising mortgage rates? If so, you might want to sit down for this news: the average rate on a 30-year U.S. mortgage just dropped to its lowest level in over a year. This could be the moment many have been waiting for, making homeownership a more attainable goal. Let’s dive into what this means for prospective buyers and the housing market as a whole.

The Current State of Mortgage Rates

According to a recent article by PBS, the average long-term mortgage rate has seen a notable decline, offering a glimmer of hope for homebuyers who have been navigating a turbulent market. Lower mortgage rates typically stimulate demand for homes, as they reduce monthly payments and increase purchasing power. But what’s behind this sudden decrease, and how might it impact the broader economy?

In 2021 and much of 2022, mortgage rates were on a steep upward trajectory, driven by multiple factors, including inflation and the Federal Reserve’s monetary policies aimed at stabilizing the economy. As rates climbed, many potential buyers were priced out of the market, leading to a noticeable slowdown in home sales. However, recent shifts in economic indicators, including lower inflation rates and a more cautious approach from the Fed, have contributed to the current decline in mortgage rates.

Why This Matters Now

With the easing of rates, first-time homebuyers and those looking to upgrade their living situations may find themselves in a more favorable position. Lower rates mean lower monthly payments and, ultimately, more home for your dollar. But while the current drop is promising, it’s essential to consider other factors at play, such as inventory levels and competition among buyers.

Key Takeaways:

Historic Low Rates: The average 30-year mortgage rate fell to its lowest level in over a year, making homebuying more affordable for many. – Increased Purchasing Power: Lower rates translate to lower monthly payments, which can expand the range of homes within a buyer’s budget. – Market Implications: While lower rates stimulate demand, the overall housing inventory remains a concern, potentially leading to competitive bidding situations. – Future Outlook: The current economic climate suggests that rates may remain low for the foreseeable future, but buyers should stay informed about changes in the market. – Cautious Optimism: While the drop is a positive sign, potential buyers should still proceed with caution and conduct thorough research.

A Moment of Reflection

As mortgage rates dip, the landscape for homebuyers is changing, offering a renewed sense of hope in a market that has felt daunting. However, it’s vital for buyers to remain vigilant and informed about both the opportunities and challenges that lie ahead. Whether you’re a seasoned investor or a first-time buyer, this could be a pivotal moment to take action.

In the end, the housing market is always evolving. Keeping an eye on these trends can empower you to make informed decisions that align with your financial goals.

Sources:

– “Average long-term mortgage rate drops to lowest level in more than a year.” PBS. [Link to PBS article]

Stay tuned for more insights and updates on the housing market as we navigate these exciting changes together!


Related update: We recently published an article that expands on this topic: read the latest post.

Related update: We recently published an article that expands on this topic: read the latest post.


Related update: We recently published an article that expands on this topic: read the latest post.


Related update: We recently published an article that expands on this topic: read the latest post.

Monthly homeownership costs now top $2,000, new data shows – CBS News | Analysis by Brian Moineau

Monthly homeownership costs now top $2,000, new data shows - CBS News | Analysis by Brian Moineau

Title: Navigating the Rising Tide: Homeownership Costs Hit New Highs

In the epic saga of American homeownership, the latest chapter seems to be taking on a rather Dickensian tone: "It was the best of times, it was the worst of times." According to recent data from the Census Bureau, the cost of owning a home in the U.S. has now surged past the $2,000 mark per month. This figure is not just a number; it's a narrative of the challenges and complexities facing millions of Americans today. As we delve into this story, let's keep it light, perhaps with a dash of optimism for those navigating these choppy financial waters.

For many, homeownership is the quintessential American dream—a symbol of stability and success. Yet, as prices rise, that dream can feel increasingly out of reach. The data reveals that both owning and renting are becoming more costly, a one-two punch that is squeezing the financial lifeline of many households. But before we descend into despair, let's take a broader look at the landscape and uncover some silver linings.

In a world that's constantly changing, it's important to remember that the real estate market is no stranger to flux. Previous decades have seen their fair share of ups and downs, and while today's figures may seem daunting, history shows that markets are resilient. The 2008 financial crisis, for example, was a time when homeownership seemed more like a nightmare than a dream, yet it eventually rebounded, albeit with significant lessons learned. Today's challenges, though formidable, are navigable with the right knowledge and a bit of patience.

This surge in costs dovetails with broader economic trends. Inflation has been a hot topic globally, with everything from eggs to energy seeing price hikes. The Federal Reserve's interest rate hikes, aimed at curbing inflation, have inadvertently made borrowing more expensive, impacting mortgage rates and, by extension, monthly payments. It's a classic case of economic cause and effect, and one that underscores the interconnectedness of global financial systems.

Interestingly, as Americans grapple with these rising costs, the trend isn't isolated to the U.S. Across the pond, the UK housing market is also experiencing its own set of challenges, with prices soaring and affordability becoming a growing concern. It's a global issue, and one that signals a need for innovative solutions and policy interventions.

But let's not lose sight of the resilience and creativity of the American spirit. In the face of rising costs, many are finding ways to adapt and thrive. The rise of remote work, for example, has allowed individuals to rethink their living situations, often opting for more affordable areas without the burden of a daily commute. Additionally, the tiny house movement and co-housing communities are gaining traction as alternative solutions to traditional homeownership.

As we ponder these developments, it's crucial to consider the role of technology in shaping the future of real estate. From virtual home tours to blockchain transactions, technology is revolutionizing how we buy, sell, and even think about homes. These innovations have the potential to make the market more accessible and efficient, offering a glimmer of hope amid rising costs.

In the grand tapestry of life, housing is but one thread, albeit an important one. As we navigate these financial waters, let's do so with a spirit of curiosity, openness, and perhaps even a bit of humor. After all, every challenge presents an opportunity for growth and reinvention.

Final Thought:

While the costs of homeownership may be climbing, so too is our capacity for innovation and adaptation. By embracing change and exploring new avenues, we can turn these challenges into opportunities. Remember, even in the face of rising tides, it's the journey—and the stories we create along the way—that truly matter.

Read more about AI in Business

Read more about Latest Sports Trends

Read more about Technology Innovations

Lumber Prices Are Flashing a Warning Sign for the U.S. Economy – The Wall Street Journal | Analysis by Brian Moineau

Lumber Prices Are Flashing a Warning Sign for the U.S. Economy - The Wall Street Journal | Analysis by Brian Moineau

Lumber Prices: The Unexpected Crystal Ball for the U.S. Economy

Who knew that our national economic outlook could hinge on something as seemingly mundane as lumber? Yet here we are, with lumber prices stepping into the spotlight as a potential harbinger of the U.S. economy’s future. As The Wall Street Journal’s article "Lumber Prices Are Flashing a Warning Sign for the U.S. Economy" suggests, the fluctuations in the cost of this humble building material might be signaling something more significant than just a seasonal shift in construction trends.

Lumber, the Economic Oracle?

To understand why lumber prices are drawing attention, let’s first dig into their role. Lumber is a fundamental component in home construction and renovation, and its demand often reflects broader trends in the housing market. When prices soar, it can mean high demand and a bustling economy. Conversely, when they plummet, it might suggest slowing construction activity or even broader economic challenges.

The recent dip in lumber prices is raising eyebrows among economists and industry watchers. But why now? The U.S. housing market, which saw a boom during the pandemic as people sought more space and remote work-friendly homes, is now facing headwinds. Rising interest rates, aimed at curbing inflation, have made mortgages more expensive, dampening the demand for new homes and, consequently, for lumber.

Connecting the Dots: Global Context

The situation with lumber isn’t just a U.S. phenomenon. Globally, supply chain disruptions caused by the pandemic and geopolitical tensions, such as the ongoing conflict involving Ukraine, have impacted the availability and cost of raw materials, including lumber. For instance, sanctions on Russia, a significant exporter of timber, have had ripple effects across international markets.

Moreover, the environmental policies aimed at sustainable forestry and reducing carbon footprints also play into the availability and cost of lumber. Countries are increasingly aware of the need to balance economic growth with environmental conservation, which can affect how and where lumber is sourced.

Beyond the Timber: Similar Economic Signals

Lumber isn’t alone in offering clues about the economy. Other commodities, like oil and metals, often serve as economic indicators. For instance, fluctuations in oil prices can signal changes in global economic activity, as seen with the recent volatility due to OPEC decisions and renewable energy advancements.

Interestingly, similar to lumber, the U.S. stock market and consumer spending patterns also provide insights into economic health. For example, luxury goods sales often thrive in a robust economy, while essentials maintain steady demand regardless of economic conditions.

A Lighthearted Reflection

Let’s not forget the humorous side of this lumber saga. Imagine a group of economists huddled around a pile of 2x4s, making predictions as if reading tea leaves. It’s a quirky reminder of how interconnected our world is, where even a simple plank of wood can tell a complex story about global economic dynamics.

Final Thoughts

While lumber prices alone won’t dictate the fate of the U.S. economy, they are a piece of a larger puzzle. They remind us to pay attention to seemingly minor details, which can have significant implications. As always, it’s crucial to consider multiple factors and expert analyses when pondering economic forecasts.

So, next time you pass a construction site or stroll through a hardware store, take a moment to appreciate the humble lumber. It might just hold the secrets to our economic future—or at least make for an interesting conversation starter at your next dinner party!

Read more about AI in Business

Read more about Latest Sports Trends

Read more about Technology Innovations

Home Values Drop in 3 More Major Cities as Downturn Spreads – Realtor.com | Analysis by Brian Moineau

Home Values Drop in 3 More Major Cities as Downturn Spreads - Realtor.com | Analysis by Brian Moineau

Navigating the Real Estate Rollercoaster: Home Values Drop in Three More Major Cities

In recent news, Realtor.com reported a dip in home values across three additional major cities, signaling a spreading downturn in the real estate market. While this might send shivers down the spines of homeowners and real estate investors, it's important to take a step back, breathe deeply, and gain some perspective.

The cities now facing decreased home values are part of a broader trend that has been gradually unfolding. Economic factors such as rising interest rates and inflation have put pressure on the housing market, not just domestically but globally. In the U.S., the Federal Reserve's attempts to combat inflation by increasing interest rates have inadvertently made mortgages more expensive, leading to a cooling effect on the previously red-hot housing market.

Interestingly, this scenario mirrors the situation in other parts of the world. For example, the UK is experiencing similar challenges, with property prices dropping due to increased borrowing costs. According to The Guardian, the Bank of England has also been raising interest rates to tackle inflation, which has had a direct impact on home buyers' purchasing power.

But before we all start panicking, let's put this into context with some historical perspective. The housing market is known for its cyclical nature, experiencing peaks and troughs over time. The 2008 financial crisis, for instance, was a significant downturn, yet the market eventually rebounded, and many homeowners saw their property values recover and even surpass previous highs.

Moreover, in these times of market adjustments, there lies opportunity. For first-time homebuyers who may have felt priced out of the market during the boom, this downturn could present a more accessible entry point. It's akin to catching a rollercoaster at just the right moment—when the ride is less daunting, but still thrilling enough to offer potential rewards.

While the housing market recalibrates, it's essential to maintain a balanced view. Real estate, like many areas of life, is unpredictable and subject to change. The key is to stay informed and be prepared to adapt to new circumstances.

In a broader sense, the current real estate climate is indicative of the economic challenges many countries are facing in the post-pandemic world. As governments and financial institutions navigate these turbulent waters, the interconnectedness of global economies becomes ever more evident.

As we watch the housing market unfold, it's a reminder that change is a constant, whether in real estate or life in general. Embrace the unpredictability, make informed decisions, and remember that downturns are often followed by periods of growth.

Final Thought:

While the news of declining home values might initially seem like a cause for concern, it also offers a chance to reassess and strategize. Whether you're a homeowner, a prospective buyer, or an investor, staying informed and flexible is the best way to navigate the ups and downs of the real estate market. Remember, in the words of Warren Buffett, "Be fearful when others are greedy, and greedy when others are fearful." Happy house hunting!

Read more about AI in Business

Read more about Latest Sports Trends

Read more about Technology Innovations

America’s 10 Most Expensive ZIP Codes Revealed—From Miami to Malibu – Realtor.com | Analysis by Brian Moineau

America’s 10 Most Expensive ZIP Codes Revealed—From Miami to Malibu - Realtor.com | Analysis by Brian Moineau

Unlocking the Secrets of America's Most Expensive ZIP Codes: From Sun-Kissed Shores to Glamorous Heights

Ah, ZIP codes—those little strings of numbers that define and divide our world, often acting as a status symbol in the realm of real estate. Recently, Realtor.com unveiled its list of America’s 10 Most Expensive ZIP Codes, and it’s a fascinating peek into the crème de la crème of U.S. neighborhoods. From the sun-soaked beaches of Miami to the star-studded hills of Malibu, these areas are more than just digits; they are a reflection of the economic, cultural, and social tapestry of America.

Miami: More Than Just Beaches and Parties

Miami, often perceived as a playground for the rich and famous, has secured its spot on this prestigious list. But there's more to this city than just its nightlife and stunning coastline. Miami is increasingly becoming a hub for tech entrepreneurs and creatives, earning the nickname "The Silicon Valley of the South." With companies like Spotify expanding their presence and major art events like Art Basel Miami Beach, the city is a melting pot of innovation and culture.

In fact, Miami's allure isn't just about opulence. It's about a lifestyle that combines work and play, where business executives might start their day with a beachfront run and end it at a chic rooftop bar. The city's inclusion in the list signals its evolving identity—one that is as much about high culture and technology as it is about luxury.

Malibu: Where Hollywood Meets Home

Moving across the country to Malibu, this ZIP code needs no introduction. Known for its breathtaking cliffs and celebrity residents, Malibu is synonymous with luxury. But beyond its glamorous façade, Malibu has a strong sense of community and environmental consciousness. The residents here are not just about living lavishly; they’re also about protecting the stunning natural beauty that surrounds them.

In recent years, Malibu has also been the focus of climate change discussions, particularly after the devastating Woolsey Fire in 2018. This has led to increased awareness and efforts toward sustainable living, even in the most luxurious of settings. The juxtaposition of wealth and environmental vulnerability in Malibu is a poignant reminder of the broader challenges facing many affluent communities worldwide.

Connecting the Dots: A Global Perspective

These ZIP codes are more than just local phenomena; they are part of a global network of affluent neighborhoods facing similar trends and challenges. From London’s Kensington to Hong Kong’s The Peak, high-value neighborhoods around the world are grappling with issues like housing shortages, environmental concerns, and the impact of globalization.

Interestingly, in the wake of the COVID-19 pandemic, there has been a noticeable shift in the real estate market. Remote work has enabled more people to seek homes outside traditional urban centers, leading to increased demand—and prices—in previously overlooked areas. This trend is reshaping real estate markets globally, as people prioritize space and lifestyle over proximity to urban workplaces.

Final Thoughts: More Than Just Numbers

Ultimately, these ZIP codes are more than just a collection of numbers; they represent dreams, aspirations, and the ever-evolving definition of luxury. Whether it’s the cultural vibrancy of Miami or the serene beauty of Malibu, these neighborhoods offer a glimpse into the diverse ways people choose to live extravagantly.

In a world where real estate can serve as both a sanctuary and a status symbol, understanding these ZIP codes helps us appreciate the broader social and economic forces at play. They remind us that while luxury has its price, it also reflects the values and priorities of those who choose to call these places home.

So, whether you're dreaming of a beachfront condo in Miami or a hillside retreat in Malibu, remember: it's not just about the ZIP code—it's about the lifestyle and community that come with it. And that, perhaps, is the true luxury of all.

Read more about AI in Business

Read more about Latest Sports Trends

Read more about Technology Innovations

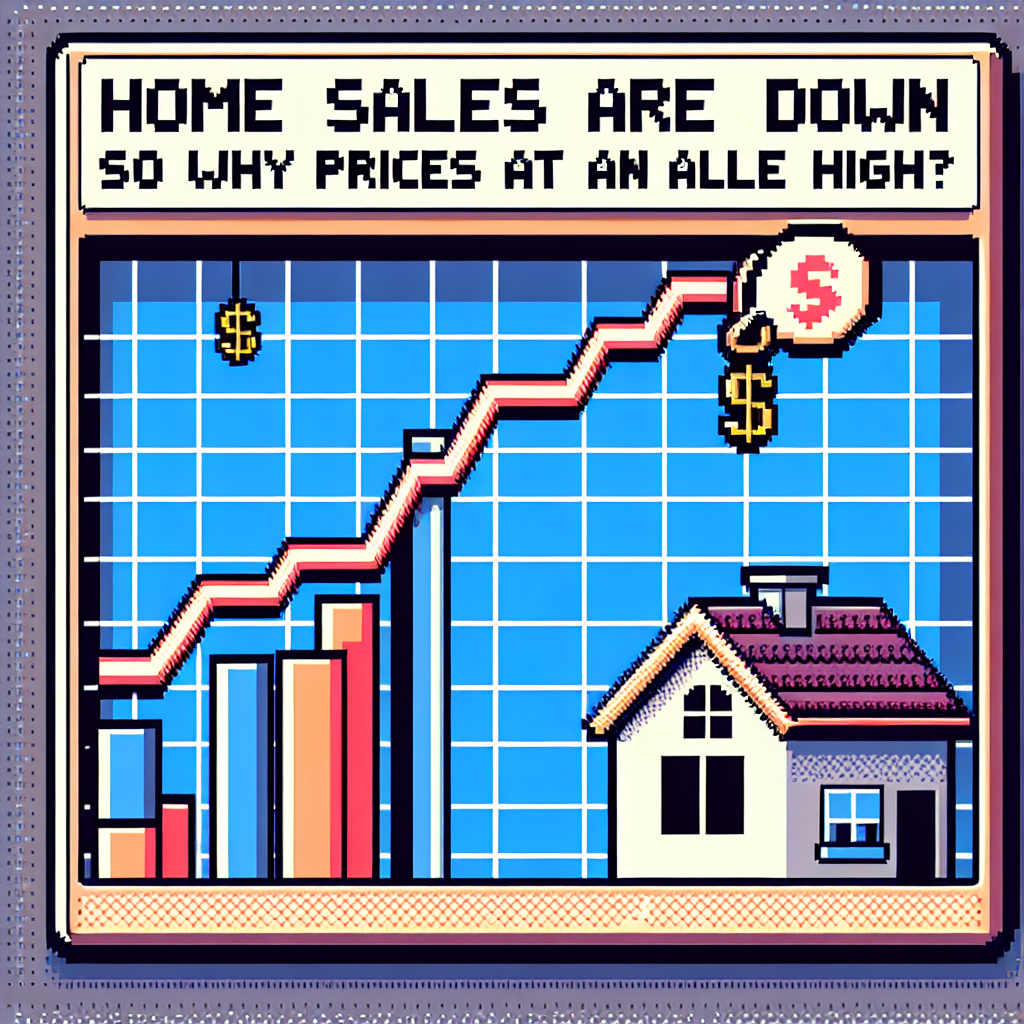
Home sales are down. So why are prices at an all-time high? – NPR | Analysis by Brian Moineau

Home sales are down. So why are prices at an all-time high? - NPR | Analysis by Brian Moineau

Why Are Home Prices Soaring Even as Sales Plummet?

In a perplexing twist within the real estate market, home sales are witnessing a downward trend, yet prices are hitting all-time highs. This seemingly paradoxical situation is leaving many scratching their heads, particularly those eager to dip their toes into homeownership for the first time. So, what's fueling this unusual scenario, and what does it mean for various players in the market?

The Equity Advantage

One of the key factors contributing to this phenomenon is the equity advantage. Homeowners who already have equity in their homes find themselves in a prime position to trade up, leveraging their existing assets to secure more desirable properties. This segment of the market benefits from the appreciation of their existing homes, making it easier to transition into larger or more desirable homes despite rising prices.

For first-time homebuyers, however, the landscape is less forgiving. With home prices at an all-time high, many are sidelined, struggling to save sufficient down payments or qualify for larger mortgages. The competitive market, with limited inventory and high demand, exacerbates their plight.

The Inventory Conundrum

The low inventory of available homes is a significant driver of this conundrum. According to a report by the National Association of Realtors, the supply of homes for sale is not meeting the current demand, creating a classic case of supply and demand imbalance. This shortage is partly due to lingering effects from the pandemic, where construction slowed, and supply chain issues stalled new developments.

Global Economic Ripples

Zooming out, the global economic climate also plays a role in this complex equation. The pandemic-induced shift in work patterns has prompted many to reconsider their living situations, often opting for more spacious or remote locations, thereby shifting demand in unexpected ways. Additionally, economic uncertainties and inflation fears have motivated some to invest in real estate as a more stable asset compared to volatile stock markets.

Interestingly, a similar narrative is unfolding in other sectors. For example, in the auto industry, supply chain disruptions have led to a shortage of new cars, pushing prices up despite fewer sales. This parallel highlights how interconnected global issues are influencing multiple markets.

Navigating the Real Estate Maze

For those currently in the market, whether looking to buy or sell, it’s a tricky landscape to navigate. Sellers are enjoying the upper hand, often receiving multiple offers above asking price, while buyers are left with tough decisions and sometimes heartbreak.

Real estate agents, like savvy matchmakers, play a crucial role in this environment. They navigate their clients through bidding wars and advise on timing and offers, all while keeping an eye on ever-changing market conditions.

Final Thoughts

In this topsy-turvy real estate market, having the right strategy and guidance is more important than ever. While those with home equity are in a favorable position, first-time buyers may need to exercise patience or explore creative solutions to achieve their homeownership dreams. As the world continues to adjust post-pandemic, and as economic policies evolve, it will be fascinating to see how the housing market adapts in the coming years.

Stay informed, stay flexible, and whether you're on the hunt for a new home or considering selling, remember that real estate, like life, is all about timing.

Read more about AI in Business

Read more about Latest Sports Trends

Read more about Technology Innovations

May home sales increase very slightly, but prices hit another record high – CNBC | Analysis by Brian Moineau

May home sales increase very slightly, but prices hit another record high - CNBC | Analysis by Brian Moineau

Title: A House of Cards? Unpacking May's Home Sales and Record Prices

Ah, the housing market—a perennial topic of conversation at dinner tables, in boardrooms, and yes, even on the internet. If you've been keeping an eye on the real estate scene (or just caught up with CNBC's latest update), you might have noticed a curious trend. In May, home sales tiptoed upwards, but just barely, while prices decided to hit the stratosphere, achieving a record high. It's like watching a seesaw where one side refuses to budge!

A Whisper of an Increase

The data reveal that sales of existing homes inched up in May compared to April, but before you pop the champagne, remember this: they're still lagging behind last year's figures. It's a bit like getting a single scoop of ice cream when you were promised a sundae. The housing market, much like the weather, can be capricious, and this slight increase suggests a cautious optimism among buyers who are willing to brave the market despite soaring costs.

The Price is Not Right?

High prices aren't exactly a new chapter in this saga. The housing market has been on a price upswing for a while now, and May's figures represent yet another peak. This upward trajectory can be attributed to several factors, including low inventory, high demand, and, in some cases, the appeal of historically low interest rates that are now inching upwards. It's a classic case of supply and demand playing out in real-time, with potential buyers finding themselves in competitive bidding wars reminiscent of an intense eBay auction.

For those tracking global economic trends, this is not an isolated phenomenon. The cost of living has been climbing worldwide, with inflation rearing its head in various sectors. From groceries to gas, prices are climbing like a mountain goat on a mission.

Global Connections

The housing market's volatility isn't contained within the borders of the United States. Across the pond, in the United Kingdom, the market is similarly turbulent. According to a report from The Guardian, UK house prices have also been climbing, driven by similar dynamics of limited supply and robust demand. Meanwhile, in China, the real estate sector is undergoing its own transformation, as the government implements measures to stabilize housing prices.

In the realm of finance, the Federal Reserve has been carefully watching these trends. The recent changes in interest rates are part of a broader strategy to manage inflation without putting the brakes too hard on economic recovery. It's a delicate dance, akin to balancing on a tightrope with global markets watching.

Final Thoughts

So, where does this leave us? Are we standing on the precipice of a housing bubble, or is this just the market finding its equilibrium? It's a complex question with no easy answers. For now, prospective homeowners and sellers alike will continue to navigate this ever-changing landscape, armed with patience, a bit of luck, and perhaps a seasoned real estate agent by their side.

While the future is always uncertain, one thing is clear: the housing market will continue to be a topic of spirited discussion. Whether you're in the market to buy, sell, or simply watch from the sidelines, remember that every peak has a valley, and every valley leads to another peak. Here's hoping for smoother rides ahead!

Read more about AI in Business

Read more about Latest Sports Trends

Read more about Technology Innovations