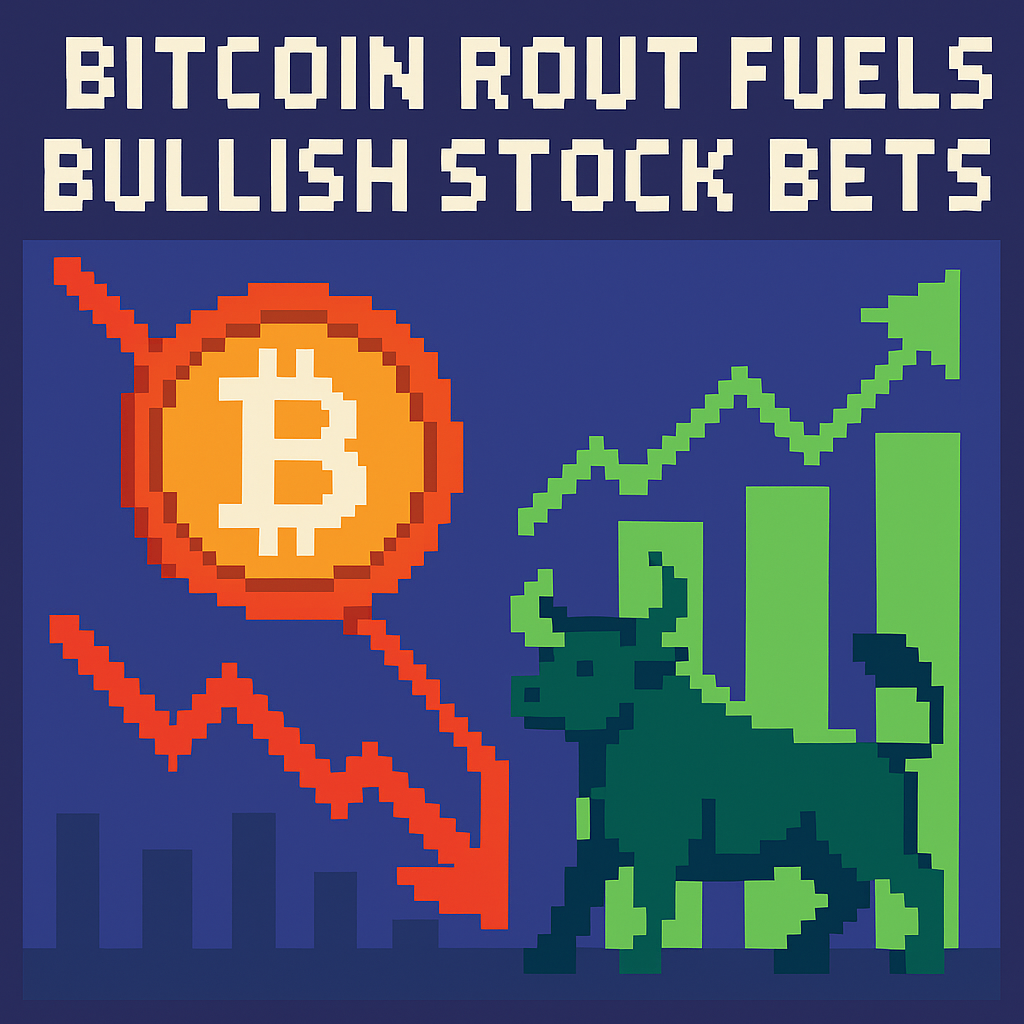
Bitcoin rout fuels bullish stock bets | Analysis by Brian Moineau

TL;DR

  • Bitcoin’s sell-off under $60,000 triggered a rare, record outflow regime in U.S. spot Bitcoin ETFs, while options traders split: a large bearish diagonal in MicroStrategy (MSTR) and a bullish diagonal in Coinbase (COIN). [1][3][4]
  • Since late 2024, options on spot Bitcoin ETFs (IBIT, FBTC, ARKB) have let dealer hedging amplify spot moves via creations/redemptions feedback loops. [5][6]
  • Miners are a hidden pressure point: CoinShares’ weighted average cash cost neared ~$79,995 per BTC post‑halving, so sub‑$65k spot tightens balance sheets and can force BTC sales or AI pivots. [8]

What the source said

CNBC reported Bitcoin dipped below $60,000 for the first time since October 2024 before rebounding, leaving BTC roughly 27% lower year‑to‑date in 2026 and about 50% off its October 2025 all‑time high near $126,000. Options activity surged: IBIT ranked among the most‑traded tickers as one jumbo diagonal in MicroStrategy collected about $56 million by selling August $125 calls and buying nearer‑dated $180 calls, while another trader spent ~$21 million on a bullish diagonal in Coinbase targeting ~$183.40 by August 21. FundStrat’s Tom Lee cited Bitcoin’s proof‑of‑work resilience as a reason to expect a rebound. [1][2]

Why it matters

  • ETF flows are the marginal driver. U.S. spot Bitcoin ETFs just posted a 13‑session, ~$4.4 billion outflow streak, the longest since their 2024 launches, and that afternoon flow regime now dictates who buys or sells spot each day. Whether those flows flip back to net inflows or extend redemptions will steer whether BTC stabilizes near $60k or revisits deeper drawdowns. [3]

  • Options→ETF→spot plumbing now transmits shocks. Since options began trading on IBIT, FBTC, and ARKB, dealer hedging can transform options exposure into ETF share demand, AP creates/redeems, and then spot prints—especially on thin‑liquidity days around month‑end. If you hold MSTR, COIN, or miners, your P/L partly depends on that 2024‑vintage microstructure. [5][6]

Original analysis

Contrarian read

  • Consensus: “ETF outflows prove institutions are leaving—winter is back.”
  • My case: The 13‑day outflow streak looks like a microstructure‑driven unwind, not a secular abandonment. It ended with a small $3.05 million net inflow on June 4, and IBIT posted a second‑largest daily outflow of $528 million a week earlier amid a record‑scale block—hallmarks of position clearing and rebalance. Watch flows over the next 4–6 weeks; normalization would frame the sell‑off as a mid‑cycle flush. [3][4]

Back‑of‑envelope math: the Coinbase diagonal

  • The flagged trade owns August 21 COIN $160 calls financed by selling June 18 calls; breakeven sits near $183.40, about 13% above Monday’s price. If COIN’s beta to BTC runs >1—as digital‑asset equities often do in volatile regimes—then a 13% COIN pop implies only a ~9–10% BTC lift. With BTC around $61,233 on June 10, the diagonal pays if spot tags roughly $67k by mid‑August—achievable if ETF outflows ease and macro headwinds (rates/dollar) cool. [1][7][10]
    • Math: 13% COIN move ÷ 1.3–1.5 beta ≈ 8.7%–10% BTC move; $61,233 × 1.09 ≈ $66,745; × 1.10 ≈ $67,356. [7][10]

Named‑stakeholder breakdown

  • MicroStrategy (MSTR): The firm disclosed selling 32 BTC for about $2.5 million between May 26–31—the first sale since 2022—signaling a willingness to tactically raise cash during stress. MSTR’s high equity beta to BTC remains a double‑edged sword for shareholders. [2][9]
  • Coinbase (COIN): Reuters reported back‑to‑back quarterly losses into May 2026 as spot volumes cooled, yet elevated implied volatility and options turnover can boost Q3 transaction and derivatives revenues. The August bullish diagonal monetizes rich implieds while targeting a summer bounce above ~$183. [11][1]
  • U.S. spot Bitcoin ETFs (IBIT, FBTC, ARKB, GBTC): After ~$4.4B in redemptions over 13 sessions, these wrappers remain the swing factor because listed ETF options invite systematic dealer hedging around strikes and expiries. Watch IBIT option open interest into month‑end and quarter‑end windows. [3][5][6]
  • Miners (Marathon, CleanSpark, Riot): With weighted average cash costs near ~$80k per BTC post‑halving, sub‑$65k spot can compress margins and force equity issuance, BTC reserve sales, or an AI‑compute pivot—each adding fragility to rallies. [8]

Flow × Price 2×2 (what each path implies)

  • Inflows + Range ($60k–$75k): Base case for stabilization; COIN outperforms MSTR; miners grind on relief.
  • Inflows + Breakdown (<$60k): Unlikely but powerful; flows fight price; snapbacks become violent.
  • Outflows + Range: Churn; options‑led rallies fade; diagonal sellers win; miners tread water.
  • Outflows + Breakdown: Pain trade; MSTR’s high beta bites; miner balance sheets crack faster; COIN delays improvement despite volatility.

Why this isn’t 2022 redux

  • The 2022 crash lacked the ETF‑options pipe; 2026 has it. IBIT options ranked in the top 1% of all options products on day one and ETF options volume grew in OCC’s May 2026 data, while the 13‑session outflow streak paused with a small inflow. That mix looks like hedging and de‑risking rather than cascading insolvencies. If rates and the dollar ease and outflows abate, a reflexive rebound toward ~$67k spot would validate the COIN diagonal without heroics. [3][6][12]

What others are missing

The options‑on‑spot‑ETF feedback loop. Since late 2024, IBIT and its peers have listed options that invite dealer gamma/vega hedging on top of ETF creations/redemptions. On down days with net redemptions, dealers short delta against long puts and short calls, which can align with AP redemptions and push spot lower into the close; on calm days, call‑overwriters recycle premium into buybacks or roll‑ups that support rebounds. IBIT options cracked the top 1% of all products at launch, and OCC’s May 2026 report shows ETF options gaining share—evidence the hedging tail can move the spot dog. Ignore this microstructure and you’ll misread both the violence and the velocity of BTC moves. [6][12][5]

What to watch next

  1. By July 31, 2026, U.S. spot Bitcoin ETFs record at least one five‑trading‑day streak of net inflows, and BTC settles between $65,000 and $69,999 on at least one daily close during that window.
  2. By the August 21, 2026 options expiration, Coinbase (COIN) trades at or above $183.00 intraday on Nasdaq, validating the bullish diagonal’s breakeven.
  3. By September 30, 2026 (Q3 2026 reporting), at least one top‑five U.S. miner by market cap announces a significant asset sale or BTC reserve draw to fund capex or AI expansion—disclosed in a Form 8‑K, earnings release, or call transcript. [8]

My take

This downturn looks like plumbing, not doom: ETF redemptions, options hedging, and miner stress hit together, exaggerating both downside and potential recovery. If I must choose into Labor Day 2026 (September 7), I prefer COIN over MSTR because Coinbase monetizes volatility and volume rebounds, while MicroStrategy’s equity beta and balance‑sheet tactics raise drawdown risk. The test is simple and measurable—two straight weeks of positive ETF flows and BTC tagging $67k–$69k—and the August COIN diagonal pays without requiring a new all‑time high. I see better odds of that tape than a 2022‑style insolvency spiral. [3]

Sources

  1. Bitcoin’s brutal sell-off sparks a flurry of trading in related stocks, including one big bullish bet — CNBC (https://www.cnbc.com/2026/06/09/bitcoins-brutal-sell-off-sparks-a-flurry-of-trading-in-related-stocks-including-one-big-bullish-bet.html) — Baseline on the BTC break below $60k and the two large diagonal options trades in MSTR and COIN.

  2. Bitcoin Drops Under $60,000—A First Since Late 2024 — Forbes (https://www.forbes.com/sites/tylerroush/2026/06/05/bitcoin-falls-below-60000-erasing-trump-fueled-rally/) — Corroborates the sub‑$60k move and frames the drawdown vs. the October 2025 ATH (~$126k).

  3. Bitcoin and Ether ETFs end record multi‑billion outflow streak — CoinDesk (https://www.coindesk.com/markets/2026/06/05/bitcoin-and-ether-etfs-end-record-multi-billion-outflow-streak) — Documents the 13‑session, ~$4.4B outflow streak and the first small inflow that ended it.

  4. BlackRock’s IBIT sheds $528 million, second‑largest daily outflow — CoinDesk (https://www.coindesk.com/markets/2026/05/28/blackrock-s-bitcoin-etf-sheds-usd528-million-the-second-largest-daily-outflow-on-record) — Details the IBIT redemption scale and role of block trades.

  5. SEC approves options trading for multiple Bitcoin ETFs — ETF.com (https://www.etf.com/sections/news/sec-approves-options-trading-multiple-bitcoin-etfs) — Confirms options launches on IBIT, FBTC, ARKB, enabling the hedging channel.

  6. Nasdaq-listed IBIT options end first day in the top 1% of all options products — Nasdaq (https://www.nasdaq.com/newsroom/nasdaq-listed-ibit-options-end-first-day-top-1-all-options-products-traded) — Shows IBIT options attained scale quickly, validating the microstructure point.

  7. Bitcoin and gold fall together as rate‑hike bets hit every hedge — CoinDesk (https://www.coindesk.com/markets/2026/06/10/bitcoin-and-gold-fall-together-as-a-rate-hike-bet-hits-every-hedge) — Sets spot context: BTC around $61,233 on June 10 and macro linkages.

  8. Bitcoin miners are becoming AI companies and selling their BTC to fund the transition — CoinDesk (https://www.coindesk.com/markets/2026/03/27/bitcoin-miners-are-becoming-ai-companies-and-selling-their-btc-to-fund-the-transition) — Cites CoinShares’ ~$79,995 weighted average cash cost and miner AI pivots.

  9. MicroStrategy sold 32 BTC for ~$2.5 million between May 26–31 — CoinDesk (https://www.coindesk.com/markets/2026/06/01/strategy-sold-32-btc-for-usd2-5-million-in-late-may-filing-shows) — Confirms the first disclosed sale since 2022 via SEC filing.

  10. Structural persistence of digital‑asset treasury betas — SSRN (https://papers.ssrn.com/sol3/Delivery.cfm/6474638.pdf?abstractid=6474638&mirid=1) — Documents that DAT equities exhibit BTC betas >1, informing the COIN beta math.

  11. Coinbase logs second straight quarterly loss as trading momentum fades — Investing.com (Reuters) (https://www.investing.com/news/stock-market-news/coinbase-logs-second-straight-quarterly-loss-as-crypto-trading-momentum-fades-4669831) — Supports the claim that early‑2026 activity softness pinched COIN fundamentals.

  12. OCC May 2026 Monthly Volume Data — OCC (https://www.theocc.com/newsroom/views/2026/06-02-may-2026-monthly-volume) — Shows the scale and growth of ETF options volume, underscoring why options hedging matters to ETF microstructure.


Related update: We recently published an article that expands on this topic: read the latest post.



Related update: We recently published an article that expands on this topic: read the latest post.

Related update: We recently published an article that expands on this topic: read the latest post.

Copper Collapse Looms as Iran Tensions | Analysis by Brian Moineau

A fragile wire: Goldman Warns on Copper as Iran War Threatens Global Economy

Copper is a bellwether for the global economy — and now that bell is ringing with alarm. Goldman Warns on Copper as Iran War Threatens Global Economy was the blunt headline echoing through markets, and for good reason. With the Strait of Hormuz intermittently closed and diplomatic deadlines looming, traders, manufacturers and miners all face the possibility that copper’s recent wobble could turn into a sharper, more prolonged fall.

Why copper matters right now

Copper is everywhere: wiring, motors, renewable-energy systems, EVs and construction. Because it sits at the intersection of heavy industry and high-tech demand, its price moves reflect both supply-chain frictions and growth expectations.

Goldman Sachs warned that copper is vulnerable to further declines if the Strait of Hormuz remains blocked. The bank’s point is twofold: one, the immediate logistics shock — stranded shipments, strained alternative ports and rising freight and insurance costs — reduces physical availability in key consumption hubs; and two, the broader macro shock from higher energy prices and slower growth undercuts demand. Together, these forces can push prices down even as some supply-side inputs become costlier. (finance.yahoo.com)

The mechanics: how a Gulf chokepoint ripples through the copper chain

  • Disrupted shipping routes. The Strait of Hormuz handles a huge share of seaborne energy flows. Its closure forces rerouting and congests alternative ports such as Khor Fakkan and Fujairah, which are near capacity. That has stranded shipments of copper cathode and delayed deliveries. (fastmarkets.com)
  • Sulfuric acid shortages. Less obvious but crucial: Middle Eastern producers supply granulated sulfur — feedstock for sulfuric acid used in copper leaching and refining. Interruptions to those chemical flows can throttle smelters and refineries in Latin America and Africa, tightening refined copper availability even if ore output remains steady. (fastmarkets.com)
  • Demand shock from higher energy costs. Oil and gas volatility feeds directly into manufacturing costs. As energy costs spike and inflation persists, project owners delay construction and manufacturers scale back production — both of which reduce copper consumption. Goldman’s warning includes this growth-sapping channel. (bloomberg.com)

Goldman Warns on Copper as Iran War Threatens Global Economy — what the numbers say

Market reports and industry intelligence point to tangible flows at risk. Fastmarkets and other market sources noted roughly 40,000 tonnes per month of copper cathode that previously moved through Jebel Ali are now running into rerouting headaches. Meanwhile, LME prices have shown volatility: a swing down to multi‑month lows and sharp rebounds tied to political headlines and ceasefire talks. These are not just abstractions — they are monthly tonnages, port berthings and processing inputs that power factories. (fastmarkets.com)

A paradox: price down while supply tightens

This is where the story gets counterintuitive. Normally a physical squeeze lifts prices. But here, a growth shock (weaker demand because of economic uncertainty and expensive energy) collided with localized availability problems. That mix can push prices lower in futures markets as traders price weaker demand, even though certain regions face acute shortages and logistical bottlenecks. In short, a market can be physically tight in places and still trade lower on macro fears. (spglobal.com)

Broader implications for industries and investors

  • Manufacturers and contractors: Watch inventories and just-in-time exposure. Firms reliant on the Gulf for semi-finished copper or sulfuric acid need contingency plans.
  • Miners and smelters: Expect margins to be squeezed and short-term shut-ins if chemical inputs don’t arrive. Capital projects may be delayed, compounding future supply risk.
  • Traders and funds: Volatility will create trading opportunities but also higher collateral and margin pressure. Hedging becomes more expensive.
  • Policy and geopolitics: A prolonged reopening impasse would push central banks and governments to reassess inflation trajectories and growth forecasts, influencing interest rates and risk premia. (spglobal.com)

How markets reacted and what changed

In recent days news flow oscillated between threats and de-escalation. Reports indicate that U.S.-Iran ceasefire talks and pauses in strikes caused oil to tumble and risk assets to rally, which in turn nudged copper prices higher from some earlier lows. That demonstrates how quickly sentiment and physical risk can reprice base metals. Still, Goldman’s central caution remains: if the Hormuz disruption persists, copper is vulnerable to further price moves — potentially downward on demand fears or upward in localized spot tightness. (bloomberg.com)

Key takeaways

  • Copper sits at the intersection of logistics risk and macro demand; both channels are active because of the Iran war.
  • The Strait of Hormuz closure has immediate logistical effects (stranded cathode flows) and secondary industrial effects (sulfuric acid shortages).
  • Prices can fall even amid regional shortages if global growth expectations deteriorate.
  • Companies with supply-chain exposure and investors in base-metals need to reassess buffer inventories and hedging strategies.

My take

We’re witnessing a classic modern supply‑shock meets demand‑shock scenario. The near-term noise will remain headline-driven — each diplomatic volley or ceasefire pause will rattle prices. But the structural lesson is longer-lived: global manufacturing chains depend on chokepoints and specialized chemical inputs more than many realize. That fragility argues for diversified sourcing and clearer industry contingency plans, not just for copper but for any commodity where a handful of routes or inputs concentrate risk.

Markets will price headlines, but the physical world — ports, warehouses, smelters and acid plants — ultimately determines who feels the pain. Companies that treat copper’s current lull as a pause, not a permanent repricing, will be better placed when the next swing comes.

Sources


Related update: We recently published an article that expands on this topic: read the latest post.

Markets Jitter as War Risks Lift Oil | Analysis by Brian Moineau

Investor Unease Builds Entering War’s Fifth Week

The phrase "Investor Unease Builds Entering War’s Fifth Week" isn't just a headline — it's the mood across markets as traders wrestle with how a protracted Middle East conflict could ripple through oil, inflation and interest-rate expectations. Treasuries rose, Brent crude hit roughly $115 a barrel, and US stock futures bounced, all while the market recalibrated bets on future Fed moves. (uk.finance.yahoo.com)

The immediate snapshot

  • Treasuries: Yields slipped as investors sought safe-haven paper, pushing prices up amid growing worries about slower growth if the conflict intensifies. (finance.yahoo.com)
  • Oil: Brent moved into the mid‑triple digits — near $115 a barrel in some sessions — on fears supply could be disrupted or that regional escalation will spur a pricing premium. (uk.finance.yahoo.com)
  • Equities: Futures bounced as risk sentiment oscillated; markets are trying to separate short-term shock from the longer-term earnings picture. (apnews.com)

These moves reflect a market caught between two narratives: one that the conflict will be contained and another that it will trigger broad inflationary pressure and slower growth.

Why bond and oil moves matter to everyday investors

Bond yields and oil prices are market barometers with real effects. Higher oil feeds into headline inflation via fuel and transport costs. If oil stays elevated for months, central banks may hesitate to cut rates and could even consider hikes — a dynamic that pushes bond yields up and raises borrowing costs across the economy. Conversely, if investors fear a sharp growth slowdown, they pile into Treasuries, lowering yields.

Over the past weeks, we’ve seen that tug-of-war. Some sessions show yields sliding as flight-to-quality dominates; others show yields rising when traders price in the inflation risk from costly oil. That whiplash is why volatility feels so high right now. (uk.finance.yahoo.com)

Markets are testing scenarios, not certainties

Investors are running through scenarios out loud: a short, localized flare-up; a prolonged regional war; or a broader escalation drawing in more actors and supply chokepoints. Each scenario produces different market outcomes:

  • Short, contained conflict: modest oil spike, transient volatility, central banks stay on hold.
  • Protracted conflict: sustained oil premium, upward pressure on inflation, central banks less likely to ease — or potentially forced to tighten — which hurts growth.
  • Major escalation: supply shocks, stagflation risk, deep equity drawdowns and safe-haven rallies in bonds and gold.

Right now, pricing indicates markets are no longer confidently betting on easing from central banks soon — in fact, at times they’ve shifted toward pricing later or fewer rate cuts. That’s a major pivot from just a few months ago. (finance.yahoo.com)

The investor dilemma

Investors face a classic policy-risk vs. growth-risk dilemma. Higher oil and energy costs push up inflation expectations; that makes central banks look hawkish and bond yields rise. But if the conflict chokes demand (tourism, trade, risk appetite), growth assumptions fall and equities suffer.

Add to that the practical issue of hedges: options and volatility products may be expensive, gold pays no yield, and owning long-duration bonds is risky if yields climb. That narrows straightforward protection choices, which amplifies unease. (investing.com)

What to watch next

  • Oil price trajectory. If Brent stays elevated above $100–115 for several weeks, inflation pressures will firm and rate expectations will adjust. (uk.finance.yahoo.com)
  • Treasury yields across the curve. Sharp moves higher in short-term yields would signal the market is pricing a more hawkish Fed. (finance.yahoo.com)
  • Risk sentiment in equities and credit spreads. Widening spreads often precede tougher economic outcomes. (investing.com)

Short-term traders will react to headlines; longer-term investors should focus on the directional persistence of these indicators rather than day-to-day noise.

What this means for portfolio posture

  • Flexibility over rigidity. In volatile geopolitics, strategies that allow rebalancing and liquidity tend to outperform rigid bets.
  • Diversify sources of carry and protection. Cash-like instruments, tactical exposure to inflation assets, and carefully sized hedges can help.
  • Avoid binary thinking. Neither “markets will always recover quickly” nor “everything’s collapsing” is a reliable base case; plan for multiple paths.

Markets are pricing uncertainty, not certainties — and that requires humility in positioning.

My take

We’re living through a market that’s oscillating between protective reflexes and risk-seeking rebounds. The headline "Investor Unease Builds Entering War’s Fifth Week" captures the tenor: investors are unsettled because the outcome is wide open and the economic pathways diverge sharply depending on how the conflict unfolds. Expect more chop, and let persistence in macro indicators — not daily headlines — guide bigger allocation moves. (uk.finance.yahoo.com)

Final thoughts

Uncertainty begets re-pricing. In the coming weeks, watch oil, yields and credit spreads for signals about which narrative is gaining traction. For now, prudence, diversification and clarity about your time horizon remain the investor’s best allies.

Sources


Related update: We recently published an article that expands on this topic: read the latest post.


Related update: We recently published an article that expands on this topic: read the latest post.

When the 60/40 Hedge Stops Working | Analysis by Brian Moineau

When the Old Hedge Breaks: Markets, War and the Vanishing Safe Harbor

Government bonds, which typically rise during periods of market stress to cushion equity losses, are now moving in the same direction with stocks as oil spikes and geopolitical shockwaves ripple through markets. That sentence — uncomfortable for anyone who built a portfolio on a 60/40 bedrock — captures the current dilemma: the classic stock-bond hedge is fraying just when investors want it most.

The last few weeks of conflict-driven volatility have amplified a trend that began during the inflation shock of 2021–22. Rising oil and commodity prices, higher-for-longer interest-rate expectations, and soaring uncertainty have pushed equities and government bonds into positive correlation episodes. Instead of bonds cushioning equity losses, both assets have been selling off together — and that changes everything for risk management.

Why bonds stopped being a reliable hedge

  • Inflation and rate expectations: When war pushes oil higher, it can revive inflation fears. Central banks respond (or are expected to respond) by keeping rates elevated, which lowers bond prices. At the same time, higher rates compress equity multiples. The net result: stocks and bonds falling together.
  • Structural balance-sheet changes: Governments ran large fiscal deficits in the pandemic era and later, increasing sovereign debt supply. This makes bond markets more sensitive to inflation and growth worries than in the low-rate decades before 2020.
  • Levered and crowded trades: Many institutional strategies (risk parity, certain hedge funds and derivative overlays) assumed negative stock-bond correlation. They used leverage expecting bonds to offset equity drawdowns. When hedges fail, forced deleveraging can magnify moves across asset classes.
  • Commodity and geopolitical channels: Oil is a key pivot. A sharp oil spike both increases inflation expectations and reroutes investor flows into energy and commodity plays — which can leave traditional defensive assets exposed.

Transitioning from these drivers to market behavior, we saw concrete signs in recent sessions: yields rose (prices fell) as stocks dropped, and volatility products saw heavy trading as investors scrambled for alternatives.

Investors hunt for new hedges

With the old playbook under stress, market participants are exploring alternatives.

  • Gold and select commodities have re-emerged as classic inflation/war hedges; gold’s recent surge illustrates its appeal when both bonds and stocks look vulnerable.
  • Volatility strategies, including long-VIX or structured products that profit from sudden volatility spikes, have enjoyed renewed interest. These can work as tactical hedges but are expensive if held long-term.
  • Defensive equity exposures (quality, dividend growers, and certain value sectors like energy and select industrials) are getting re-evaluated for their resilience in stagflation-like scenarios.
  • Real assets and inflation-linked bonds (TIPS in the U.S.) are rising on investor lists, though TIPS correlate with nominal bonds when real rates move.
  • Some allocators are leaning toward absolute-return or multi-strategy funds that can short or hedging dynamically, while others increase cash buffers to preserve optionality.

Importantly, none of these is a perfect substitute: each hedge has trade-offs in cost, liquidity, and long-run return drag.

Government bonds, which typically rise during periods of market stress to cushion equity losses, are now moving in the same direction with stocks as oil…

This sentence deserves its own moment because it spells the practical problem for long-term investors: if your bond sleeve no longer reliably cushions equity drawdowns, portfolio outcomes change. Retirement glide paths, target-date funds, and many risk models assumed a persistently negative stock-bond correlation — an assumption the market is challenging.

Analyses from major institutions and research groups show this is not a one-off. Historical data indicate that negative stock-bond correlation was an “anomaly” linked to a long disinflationary regime. When inflation breaches certain thresholds — or when supply shocks dominate — correlation tends to revert to positive territory. So we aren’t merely reacting to headlines: the macro structure has changed.

Practical moves for investors (the checklist)

  • Revisit assumptions: Re-run stress tests on multi-asset portfolios using scenarios where stocks, bonds and the dollar all fall together. That “triple red” outcome is more plausible now than it was five years ago.
  • Size hedges to the mission: For those near retirement or needing liquidity in the next few years, costlier but more reliable hedges (options, managed volatility products, inflation-protected debt) may be justified. Long-horizon investors can tolerate some short-term drag.
  • Diversify hedge types: Combine real assets, volatility exposure, and selective credit or alternative strategies rather than overloading on one single hedge that might fail under certain stressors.
  • Watch liquidity and counterparty risk: In a stress event, illiquid hedges can be unusable or deeply discounted, and leveraged SCAs can force unhelpful sales.
  • Keep fees and decay in mind: Some hedges (constant volatility ETFs, long-dated options) have structural costs. Know the expected drag and calibrate position sizes accordingly.

What history and research tell us

Research and institutional commentary support the idea that stock-bond correlation depends on the macro environment. Periods of high inflation or supply-driven shocks have historically produced positive correlations. Recent work by policy and research groups highlights that the pandemic-era low-inflation regime was not the default; markets can and do revert to regimes where traditional diversification underperforms.

That doesn’t mean bonds are irrelevant — they still provide income and play many roles in portfolios — but their blanket role as downside insurance is less reliable when inflation and policy-rate uncertainty dominate market moves.

My take

We’re in a regime where context matters more than blanket rules. The 60/40 baseline still has merits for long-term return expectations, but investors must be honest about what it will and won’t do in a surge-inflation, geopolitically stressed world.

So, be proactive: test portfolios against bad-but-plausible scenarios, size hedges to your time horizon and tolerance for short-term pain, and accept that some protection will cost you. In a market where war, oil, and inflation can conspire to move supposedly uncorrelated assets together, resilience is built through flexibility and planning — not faith in past correlations.

Closing notes

  • Expect more headline-driven volatility as commodity prices react to geopolitical developments.
  • Central bank communications will matter — and may move bond markets more than geopolitical headlines at times.
  • For most investors the response will be gradual: rebalancing assumptions, diversifying hedge types, and paying attention to liquidity.

Sources


Related update: We recently published an article that expands on this topic: read the latest post.


Related update: We recently published an article that expands on this topic: read the latest post.

Bessent Reaffirms Strong Dollar, Markets | Analysis by Brian Moineau

When the dollar steadied: why Scott Bessent’s “strong dollar” line mattered more than you might think

The dollar had been wobbling — flirting with multi-month lows and stirring talk that Washington might be quietly propping up other currencies. Then U.S. Treasury Secretary Scott Bessent went on CNBC and said two short, decisive things: “Absolutely not” when asked if the U.S. was intervening to buy yen, and reiterated that the administration pursues a “strong dollar policy.” Markets perked up. The greenback bounced. Headlines followed.

This felt, in microcosm, like a lesson in how words from policy-makers can move markets as effectively as trades.

What happened (the quick story)

  • Late January 2026: the yen had strengthened from earlier weakness and speculation spread that Japan and the U.S. might be coordinating intervention to support the yen.
  • On January 28, Treasury Secretary Scott Bessent told CNBC the U.S. was “absolutely not” intervening to buy yen and reiterated a strong dollar policy.
  • The dollar rallied off recent lows after his comments; the yen slipped back, and markets interpreted the remarks as a reassurance that Washington was not trying to engineer a weaker dollar via intervention.

Why that line—“strong dollar policy”—matters

  • A “strong dollar policy” is shorthand for favoring market-determined exchange rates, sound fiscal and monetary fundamentals, and resisting competitive devaluations or direct intervention to manipulate exchange rates.
  • For global markets, it signals the U.S. won’t be an active buyer of other currencies to prop them up, which matters particularly for countries like Japan where swings in the yen can have outsized effects on inflation and corporate margins.
  • Policy credibility is as important as policy itself: when a Treasury secretary publicly denies intervention, traders often take it as evidence that large-scale official flows aren’t coming — and prices adjust quickly.

The broader backdrop

  • Tensions over currency moves have been building for months. Japan has publicly worried about a “one-sided” depreciation of the yen, and Tokyo has signaled readiness to intervene if moves threaten stability.
  • U.S. political rhetoric has been mixed: President Trump’s comments in recent weeks — saying the dollar is “great” while also showing tolerance for a weaker dollar historically — left some ambiguity. Markets sniff around any hint of policy shifts, and uncertainty can quickly amplify currency moves.
  • Against that geopolitical and macro backdrop, Bessent’s clear denial functioned as a stabilizer: not because it changed fundamentals overnight, but because it reduced the probability assigned by traders to coordinated, official intervention.

What traders and investors should care about

  • Short-term volatility can still spike. A denial reduces one tail risk (coordinated intervention), but it doesn’t eliminate other drivers: differing interest-rate paths, U.S. growth surprises, Japanese policy moves, and flows into safe-haven assets all matter.
  • Policy wording matters. The phrase “strong dollar policy” is deliberately flexible. Officials can point to “fundamentals” and structural reforms as the path to a stronger currency — not necessarily market meddling.
  • Watch Japan closely. Tokyo has both motivation and tools to act if the yen’s moves threaten domestic price stability. Even without U.S. participation, Japanese intervention — single-country FX intervention or domestic measures — can still move markets.

How the market reacted (the anatomy of a rebound)

  • Immediate reaction: the dollar index climbed from a recent low and the yen fell about 1% against the dollar after Bessent’s interview. That’s a typical intraday renewal of risk-off/risk-on positioning being reversed by a high-profile denial.
  • Medium-term: such comments can shave volatility expectations and reduce speculative positioning premised on official cooperation. But they don’t alter the structural story: slower U.S. dollar momentum or a stronger yen could return if macro drivers shift.

My take

There’s a theater to modern currency policymaking where words, reputation and expectations often move markets faster than actual central bank or treasury transactions. Bessent’s clarity mattered because markets had been pricing in a chance of official support for the yen; by taking that off the table, he removed a source of uncertainty. But this didn’t change the underlying tug-of-war between U.S. growth prospects, Fed policy expectations, and Japan’s domestic pressures. Expect intermittent fireworks — especially around macro prints and any fresh comments from Tokyo.

Notes for different readers

  • For currency traders: price in the possibility of Japanese-only moves and monitor verbal cues from both Tokyo and Washington closely.
  • For corporate treasurers and importers/exporters: hedge plans should reflect that official U.S. support for other currencies is unlikely; hedging remains the primary shield against FX risk.
  • For long-term investors: narrative shifts (strong dollar vs. weaker dollar) matter for allocations to global equities and commodities; watch policy consistency more than single remarks.

Sources

Final thought: markets crave certainty. In FX, certainty is often ephemeral. Clear, credible messaging from policymakers can buy time — but it can’t permanently substitute for economic fundamentals.


Related update: We recently published an article that expands on this topic: read the latest post.


Related update: We recently published an article that expands on this topic: read the latest post.


Related update: We recently published an article that expands on this topic: read the latest post.

Nvidia Earnings: Verdict for AI Leadership | Analysis by Brian Moineau

Nvidia at the Crossroads: Big Expectations, Bigger Questions

The buzz was electric heading into Nvidia’s fiscal third-quarter earnings on November 19, 2025. After years of setting the bar for AI-driven growth, NVDA arrived at the report with sky-high expectations — and a chorus of voices telling investors to either hold fast for the long haul or tighten the seatbelt for a fast ride down if things go wrong.

This post digests a recent TipRanks piece featuring top investor Adria Cimino, places that view against the broader market backdrop, and offers a grounded take on what mattered (and what still matters) after the results landed.

Why this quarter felt different

  • Nvidia’s leadership in AI datacenter GPUs — particularly the Blackwell family — had been fueling extraordinary demand across cloud providers and enterprise AI deployments. Analysts and market narratives had tilted heavily bullish going into the print. (tipranks.com)
  • At the same time, high-profile skeptics and macro concerns introduced volatility risk: a few big shorts and notable institutional moves (for example, some stake sales) added a frisson of near-term unpredictability. That’s one reason commentators cautioned about big swings around the release. (tipranks.com)
  • TipRanks highlighted a common investor dilemma: impressive fundamentals and growth potential versus frothy multiples and the risk of sentiment-driven pullbacks. Adria Cimino framed it as a long-term buy thesis tempered by a recommendation to manage position sizing if you’re nervous. (tipranks.com)

What the market and the headlines were expecting

  • Street consensus headed into the report expected another blowout quarter driven by datacenter revenue and continued strength in AI capex; pre-report estimates centered on revenue in the mid-$50 billions and elevated margins. (nasdaq.com)
  • Analysts broadly favored Nvidia: the consensus on TipRanks showed heavy Buy support and an average 12‑month target implying material upside from then-current prices. But that bullishness coexisted with warnings about valuation and concentration risk. (tipranks.com)

The real outcome (brief recap with context)

Nvidia reported fiscal Q3 results on November 19, 2025 that materially beat expectations: revenue and EPS were well above consensus, driven by an outsized datacenter performance and sustained demand for the Blackwell GPUs. The company also issued bullish guidance for the following quarter. Market reaction was positive, with shares moving higher after the print. (kiplinger.com)

How to read Cimino’s view now

  • The TipRanks piece distilled a pragmatic long-term endorsement: Cimino views Nvidia’s multiple as justifiable given the company’s earnings power and secular position in AI infrastructure, but she also urged that investors consider locking in gains or trimming exposure if they’re uncomfortable with near-term volatility. (tipranks.com)
  • That advice maps well to a risk-management playbook: for long-term believers, dollar-cost averaging or holding but trimming size can reduce regret if sentiment shifts; for traders, earnings-driven swings create opportunities — and risks — for quick profits or losses.

Three practical investor angles

  • For long-term holders:
    • Nvidia’s structural leadership in AI hardware makes a compelling case to stay invested, particularly if you’re multi-year focused and can stomach large interim drawdowns. The company’s margin profile and datacenter growth were strong evidence for that thesis. (proactiveinvestors.com)
  • For swing traders:
    • Earnings and guidance often generate high intraday volatility. Having a pre-defined plan (entry, stop-loss, position size) is crucial. The presence of big shorts and institutional stake moves can amplify moves. (barrons.com)
  • For cautious or value-oriented investors:
    • Consider taking partial profits after a long run-up or using hedges (like options strategies) to protect gains while retaining upside exposure. Pay attention to guidance consistency and signs of demand broadening beyond hyperscalers.

Signals to watch next

  • Datacenter demand durability beyond hyperscalers — broad adoption across industries reduces concentration risk.
  • Gross margin trajectory and supply-chain signals; Nvidia’s margins historically exceeded many peers, but sustaining that while scaling is key. (tipranks.com)
  • Management guidance and commentary about customer mix, international demand, and inventory dynamics.
  • Macro and sentiment shifts: headline shorts, large stake sales, or regulatory news can create outsized price moves detached from fundamentals. (barrons.com)

What this means for the average investor

  • The take from TipRanks — and echoed by many analysts — is straightforward: Nvidia’s business fundamentals justify a bullish long-term stance, but the stock’s multiple and the market’s sentiment make it a bumpy ride. If you believe in Nvidia’s multi-year role powering AI infrastructure, align your allocation and expectations to that horizon. If you’re near-term focused, prepare for volatility or consider reducing concentrated exposure. (tipranks.com)

My take

Nvidia’s Q3 showed why it’s central to the AI hardware story: the results validated the demand thesis. But market leadership comes with higher scrutiny and a premium multiple — and that premium is sensitive to sentiment swings. For investors, the most productive move is usually not to chase headlines but to match allocation to conviction and to protect against the inevitable short-term noise. Treat NVDA like a powerful engine: tremendous upside with a throttle that occasionally sticks.

Sources


Related update: We recently published an article that expands on this topic: read the latest post.


Related update: We recently published an article that expands on this topic: read the latest post.