TL;DR
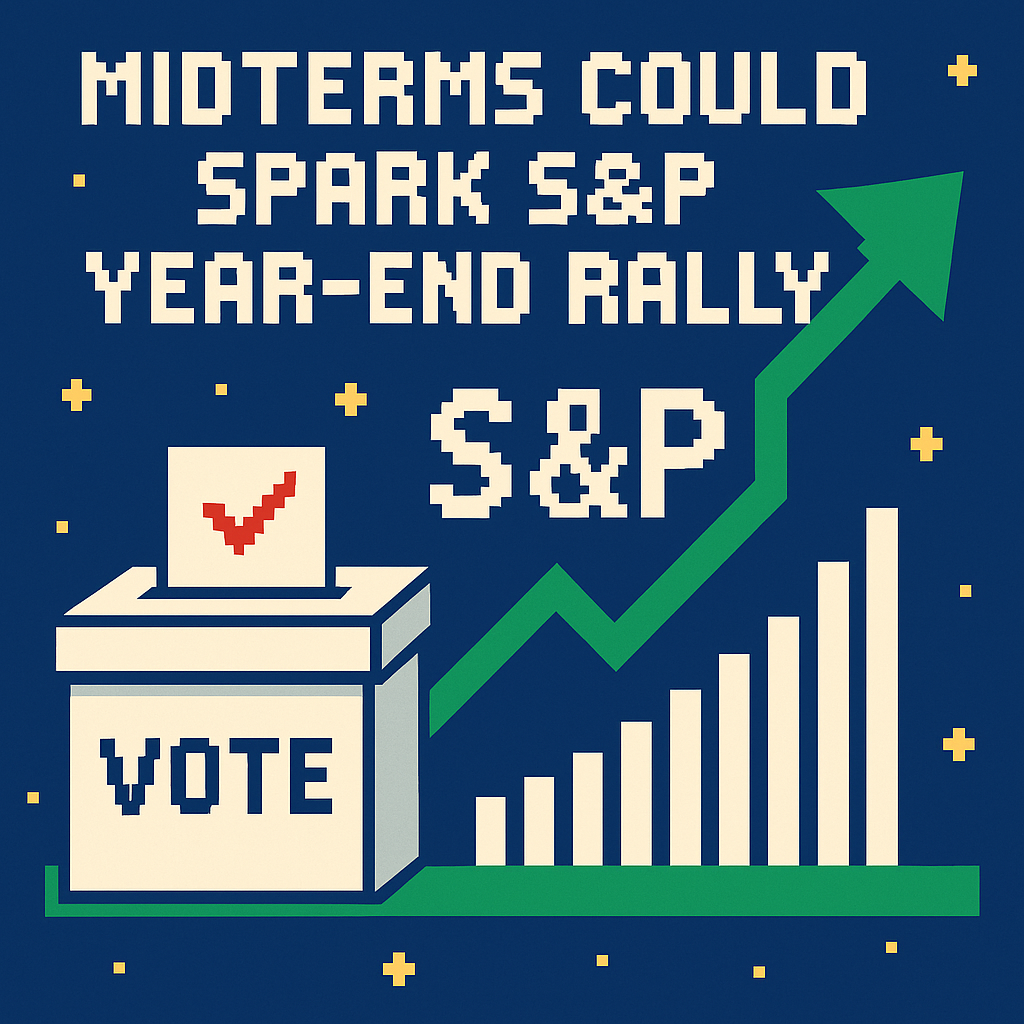
- Midterm elections and the S&P 500 rally: history says the three‑month “sweet spot” around the vote has positive median returns of 7% and wins in 21 of the last 23 cycles, but 2026’s 5%+ Treasury yields could muffle the effect. [1][5]
- The unusual twist in 2026 is profit growth: analysts expect roughly 30% year‑over‑year S&P 500 EPS growth this quarter, a tailwind strong enough to overcome higher yields—if those yields stop rising. [2]
- Concentration risk is the joker: with the top 10 stocks over 40% of the index, any seasonal pop hinges on a handful of mega caps behaving; breadth, not partisanship, will decide the rally’s staying power. [4][8]
What the source said
Yahoo Finance highlights Deutsche Bank strategist Jim Reid’s chartbook on midterm seasonality. His team finds the S&P 500 has risen in 21 of the last 23 midterm cycles in the window from one month before Election Day to two months after, with a 7% median gain; 1978 and 2018 were exceptions tied to inflation and rising rates (1978) and a rate‑driven selloff plus U.S.–China trade tensions (2018). Reid argues 2026 looks more supportive because earnings season is about to be “blockbuster,” with consensus expecting ~30% year‑over‑year EPS growth, which could supply a tailwind despite recent rate volatility. [1][2]
Why it matters
Two clocks are ticking into November 3, 2026: Washington’s election clock and Wall Street’s profit clock set by quarterly earnings. Index investors using SPY, IVV, and VOO have real money at stake in whether the midterm playbook—buy weakness into late October, ride a relief rally—beats the bond market’s message. If seasonality works, passive portfolios win by doing nothing; if yields or a profit hiccup swamp the pattern, concentrated S&P 500 exposure could translate small tech stumbles into big portfolio drawdowns. [1][2][5][10]
The political “who wins Congress” question is overrated for markets. What matters most to allocators—from pension CIOs to systematic funds—is whether peak rate fears ease while earnings breadth widens. In a year when the 10‑year Treasury has flirted with 5.3% and AI‑linked mega caps dominate index weight, the midterm bounce will be decided by flows, rates, and profits, not party labels. [5][8]
Original analysis
Consensus: “Midterms usually deliver a year‑end rally; just hold your S&P 500 and let history work.” My read: that’s incomplete in a 5%‑yield world with a top‑heavy index. Seasonality is real—but conditional on rates and earnings breadth. [5]
- Historical analogue: 2018 is the cautionary case. The S&P 500 fell roughly 19.6% from October 3 to December 24, 2018 as the Fed hiked rates, QT tightened liquidity, and trade risks rose; the selloff ended only after the Fed pivoted more dovish in January 2019. [1][6]
- Historical analogue: 1978 is the inflation case. A mid‑November hike in the prime rate to 11% triggered another sharp market drop as stagflation anxieties mounted. High and rising rates trumped calendar effects. [7]
What’s different in 2026 is earnings power. Multiple outlets cite FactSet estimates near 30% YoY growth for Q3 S&P 500 EPS—an unusually fat cushion. If profits are that strong, bears need either higher discount rates or narrow breadth to keep a lid on prices. [2]
- Rates, the spoiler: the 10‑year Treasury has hovered around 5.24%–5.36% this week, its highest zone since the early 2000s. Each uptick compresses equity multiples, especially for long‑duration mega caps that dominate the S&P. A seasonal pattern that “usually” adds ~7% can be erased by a 50–75 bps yield surge. [1][5]
- Concentration risk, the amplifier: the top 10 companies represent 40%+ of the S&P 500’s cap weight. If a few AI platform leaders underdeliver, seasonality won’t save the cap‑weighted index; equal‑weight and cyclicals could still work. [8]
Back‑of‑envelope math
- Assume 2026 Q3 S&P 500 EPS grows 30% YoY (consistent with FactSet via AP). If the trailing EPS run‑rate were $240, a 30% quarterly YoY lift implies an annualized run‑rate around $240 × 1.30 ≈ $312. [2]
- Holding the forward P/E at 20x yields a fair‑value handle near 20 × $312 ≈ 6,240. At 21x, that’s ~6,550; at 22x, ~6,864. If the 10‑year stays >5%, a 1–1.5‑turn multiple compression (to 19x) still leaves ~5,928—directionally positive but likely shy of the historical ~7% median unless yields relent. [1][5]
A 2×2 framework: Seasonality vs. 2026 macro
- Yields down, earnings broadening: Best setup. Expect cap‑weighted S&P to outperform equal weight; mega caps lead; Q4 total return near or above the ~7% midterm median. [1]
- Yields down, earnings concentrated: Relief rally but fragile. Mega caps carry; breadth lags; equal weight trails; multiple expansion limited by concentration risk.
- Yields up, earnings broadening: Rotation market. Equal‑weight S&P and cyclicals outperform; cap‑weighted index grinds rather than sprints.
- Yields up, earnings narrow: 2018‑lite. Seasonality fails; downside skew returns as a handful of tech heavyweights dictate index direction. [6]
Named‑stakeholder breakdown
- Nvidia, Microsoft, Apple: outsized index impact; their prints and guidance will define whether “earnings breadth” shows up or the rally remains top‑heavy. [8]
- iShares Core S&P 500 (IVV) and Invesco S&P 500 Equal Weight (RSP): If yields rise, RSP likely cushions via factor rotation; if yields fall and AI leadership endures, IVV wins. [8]
- Treasury Borrowing Advisory Committee/Treasury market: Any change in refunding plans or buyback operations that tames term premia could reignite a seasonal bid; further supply‑driven yield spikes would snuff it out. [5]
Bottom line: history argues for a positive three‑month window into and out of November 3, 2026. This year, the balance of power sits with the bond market and a small set of profit engines. If yields stabilize and earnings broaden, the midterm playbook works. If not, expect a more rotational, narrower—and potentially underwhelming—finish to the year. [1][2][5][8]
What others are missing
The flow calendar, not just the election calendar. Corporate buyback blackouts typically accelerate around mid‑September and lift progressively through late October as companies report, reopening a major source of equity demand into the midterm “sweet spot.” Citadel Securities flags blackout timing beginning around September 12 and more than $1.1 trillion of 2026 buyback authorizations coming back into open windows, a scale that can shift net demand. Watch the blackout‑lift and desk flow data as closely as polls because this mechanical supply‑and‑demand switch can outweigh partisan headlines in October–November 2026. [9][1][3]
What to watch next
By November 30, 2026, the 10‑year Treasury yield will have closed below 5.00% on at least one trading day as supply events pass and CPI prints reset term‑premium fears. [5]
Between October 15 and December 31, 2026, the S&P 500 Equal Weight Index (RSP) will outperform the cap‑weighted S&P 500 by at least 1.5 percentage points if earnings beats extend beyond the top 10 names. [8][2]
From the S&P 500’s October 10, 2026 close to December 31, 2026, the index will post a total return of at least +4%, consistent with—but shy of—the historical midterm median as high yields cap multiples. [1][5]
My take
I’m betting on a midterm bump, not a melt‑up. With the 10‑year near 5.3%, the market needs either falling yields or blow‑out breadth to print a classic 7%+ “sweet spot” move. The profit setup looks unusually good in 2026, which keeps me constructive on a positive Q4 tape. I’d express the view with some equal‑weight and cyclicals alongside mega caps, because concentration makes the index vulnerable to one or two earnings misses; if rates back off even modestly in November, the rally has room. [5][2][8]
Sources
[1] History says midterms could hand the S&P 500 a year-end rally: Chart of the Day — Yahoo Finance (https://finance.yahoo.com/markets/article/history-says-midterms-could-hand-the-sp-500-a-year-end-rally-chart-of-the-day-100000388.html) — Deutsche Bank’s midterm seasonality: 21/23 win rate, 7% median in the three‑month window and the 1978/2018 exceptions.
[2] US stocks rise to a record on expectations companies will make even fatter profits — AP News (https://apnews.com/article/e8285ec7afbe81e9df277e8ee2127982) — Cites FactSet: analysts now expect nearly 30% YoY S&P 500 EPS growth for Q3 2026.
[3] Outlook 2026 — LPL Research (https://www.lpl.com/content/dam/lpl-research/documents/outlook-2026-report.pdf) — Midterm stats: average 14.5% in the 12 months after midterms and a historically high hit rate for positive returns.
[4] Midterm Elections and Stock Market Trends — BlackRock (https://www.blackrock.com/us/financial-professionals/insights/2026-midterm-elections-and-market-performance) — Sector‑level dispersion; midterm years weaker on average; pre‑election rally often begins ~22 trading days before the vote.
[5] How major US stock indexes fared (Oct 5–9, 2026 series) — AP News (https://apnews.com/article/44b75c188756038371cf3112ede9cee8) — Documents the 10‑year Treasury in the 5.24%–5.36% range near multi‑decade highs and the S&P 500 hovering near records in early October.
[6] Market Events and Investor Reactions — U.S. Congress (govinfo.gov) (https://www.govinfo.gov/content/pkg/CHRG-116shrg36538/pdf/CHRG-116shrg36538.pdf) — Details the 2018 Q4 selloff: S&P 500 fell ~19.6% from Oct 3 to Dec 24 amid Fed tightening and trade tensions.
[7] Boost in Prime Rate to 11% Triggers Big Market Drop — The Washington Post (https://www.washingtonpost.com/archive/business/1978/11/14/boost-in-prime-rate-to-11-triggers-big-market-drop/0ec75690-47f4-46ce-8df3-5cf7b76ae49d/) — 1978 case study: mid‑November prime rate hike coincided with sharp equity declines around the midterms.
[8] Building intentional US equity exposure in portfolios — J.P. Morgan Asset Management (https://am.jpmorgan.com/be/en/asset-management/adv/insights/portfolio-insights/equity/building-intentional-us-equity-exposure-in-portfolios/) — Confirms S&P 500 concentration: top 10 companies >40% of index as of September 2026.
[9] September Setup: The Asymmetry Has Changed — Citadel Securities (https://www.citadelsecurities.com/news-and-insights/global-market-intelligence/september-setup/?series=global-market-intelligence) — Notes blackout timing (beginning around Sept 12) and the scale of buyback authorizations returning to open windows later, shaping equity flow into late October/November.
[10] 2 U.S.C. § 7 and USAGov Midterm Page — U.S. Code and USAGov (https://uscode.house.gov/view.xhtml?edition=prelim&num=0&req=granuleid%3AUSC-prelim-title2-section7) (https://www.usa.gov/midterm-elections) — Establishes Election Day (first Tuesday after the first Monday in November) and confirms the 2026 midterm timing (November 3, 2026).