
EU orders Meta to disable addictive | Analysis by Brian Moineau

TL;DR

  • Brussels ordered Meta to switch off Facebook and Instagram’s “infinite scroll” and “autoplay” by default under the EU’s Digital Services Act (DSA), with penalties up to 6% of global turnover at stake. The European Commission’s preliminary findings arrived on July 10, 2026. [1][2][3]
  • The bigger risk than a fine is an EU product fork that slows Meta’s experimentation velocity and trims Reels watch time and ad impressions—the twin growth levers Meta highlighted in its FY2025 report. [4]
  • TikTok Lite’s April 2024 EU intervention showed the playbook: the Commission pushes live product changes, not PR or warning labels, when it labels a feature “addictive.” [5]

What the source said

AP reported that on July 10, 2026 the European Commission issued preliminary findings that Facebook and Instagram deploy “addictive design” features—autoplay, infinite scroll, push notifications, and engagement‑maximizing recommendations—that risk users’ physical and mental health, including minors across the EU‑27. The Commission wants Meta to disable those features by default, strengthen break prompts, and reduce the primacy of engagement in recommendations; Meta pointed to “Teen Accounts,” nightly lockouts, and a parent‑set 15‑minute time cap option as safeguards. If the findings become a formal decision, DSA penalties can reach 6% of Meta’s global revenue, and Meta can submit a response before any order is finalized. [1][3][6]

Why it matters

  • Stakeholders span EU teens and parents (default safety versus DIY controls), EU ad buyers (fewer impressions per euro if sessions shorten), Meta shareholders (compliance costs, slower growth), and every other “very large online platform” (VLOP) designated under the DSA as Brussels redraws the line between “engaging” and “manipulative” design. [2][3][7]
  • A DSA decision that hard‑codes design‑by‑default changes travels fast: it becomes a template for the UK and Australia and a data point for US state attorneys general litigating engagement features. The fine is a one‑off; the product constraints become a standing EU baseline. [2][5]

Original analysis

EU demands Facebook and Instagram dismantle design features it calls addictive for users

Consensus view: This is an EU shot across the bow that ends in a manageable fine and cosmetic tweaks. Contrarian read: The Commission is trying to edit the engagement stack itself, not negotiate labels—its April 2024 TikTok Lite move in France and Spain froze a rewards feature in days, signaling that “addictive design” triggers product shutdowns, not disclosures. [5]

Meta’s exposure is twofold: fines and experimentation friction. Meta’s growth engine depends on high‑throughput A/B tests on feeds, Reels, and notifications; default‑off autoplay and non‑infinite feeds in the EU force region‑specific branches that reduce statistical power and slow ranking rollouts. That drag does not show up in a penalty headline, but it compounds quarter after quarter for EU audiences and any global models trained with EU data in the mix.

Back‑of‑envelope calculation (the fine versus recurring drag):

  • Meta FY2025 revenue: $200.966 billion. [4]
  • Max DSA fine: 6% of global annual turnover. [3]
  • 6% × $200.966B = $12.06B (0.06 × 200.966).
  • A 2% ongoing revenue drag from sustained EU design constraints would be ≈$4.02B per year (0.02 × $200.97B), which can outweight a one‑time hit if constraints persist across 2026–2028 as enforcement matures. [4]

Historical analogue (TikTok Lite, 2024):

  • In April 2024, the Commission opened DSA proceedings against TikTok Lite’s “rewards for watch time” in France and Spain, signaled interim suspension, and TikTok paused the feature across the EU almost immediately. The lesson from Brussels: if a feature is framed as addictive, the remedy is to disable it by default, not simply warn or label it. [5]

Named‑stakeholder breakdown:

  • Meta: In 2025, ad impressions rose 12% year over year and average price per ad rose 9%, both sensitive to session length and video continuity—precisely what autoplay and infinite scroll amplify. Expect an “EU mode” that preserves recommendation quality while trimming endless continuity. [4]
  • European Commission: After designating Facebook and Instagram as VLOPs, this becomes a flagship DSA test; a soft settlement undermines the regime, while a hard remedy establishes that “addictive design” can trigger binding defaults across the bloc. [2][7]
  • Advertisers in the EU: Shorter sessions and fewer seamless video handoffs mean fewer mid‑scroll and mid‑video impressions; media buyers will seek higher‑quality creative, tighter frequency caps, and may swing incremental short‑form video spend toward YouTube if its defaults remain friendlier—until the Commission looks there, too. [2]
  • US regulators and AGs: State AG complaints have argued that engagement‑maximizing defaults harm minors; an EU design mandate—if finalized—becomes fresh evidence that “safe defaults” are technically and commercially viable at scale. [2]

A typology for “engagement engines” under DSA pressure:

  • Continuity drivers: autoplay and infinite scroll keep users moving without choices; squarely targeted for default‑off. [2]
  • Trigger drivers: push notifications pull users back; expect rate limits, quiet hours, or higher‑friction opt‑ins as defaults. [2]
  • Targeting drivers: personalized recommendations steer attention; not banned, but likely tuned for diversity and “breaks,” not pure watch‑through. [2]
  • Guardrails: teen accounts, time caps, and break nudges exist today; the Commission says current versions are easy to dismiss and wants enforced, stickier defaults. [1][2][6]

The bottom line: Meta can write a check; it cannot easily replace the automaticity that turns short sessions into long ones, and the DSA aims straight at that mechanic. [2][3]

What others are missing

Coverage centers on fines and teen settings, but the hidden cost is product velocity in the EU‑27. Default‑off autoplay and scroll force Meta to split core feed logic, notification cadence, and Reels playback into a region‑specific branch, which multiplies concurrent experiments, shrinks per‑variant samples, and stretches time to statistical confidence for ranking tweaks. That slows learning loops on video, where small watch‑time deltas drive big ad‑impression gains; Meta’s FY2025 numbers show it leaned on ad impressions (+12% YoY) to grow, so a slower release cycle hits the revenue engine more than a headline penalty. [4]

What to watch next

  1. By Q4 2026, Meta pilots an “EU mode” on Facebook and Instagram with default‑off autoplay and infinite scroll plus stronger break prompts, and claims in earnings or a blog post that engagement impact is “limited”; independent trackers (e.g., IAB Europe AdEx or SMI) show at least a 2‑percentage‑point EU shift of short‑form video ad spend toward YouTube by Q1 2027 if Reels watch time dips.
  2. By H1 2027, the European Commission issues a final DSA decision that includes binding design commitments and either a symbolic fine under 2% of FY2025 revenue or a suspended fine contingent on milestones. [2][3]
  3. By June 30, 2027, at least one other VLOP with heavy video autoplay—TikTok or YouTube—receives a formal DSA action focused on default design settings, confirming that “addictive design” enforcement is cross‑platform. [5][7]

My take

If I ran Meta’s EU product, I would stop litigating defaults and start shipping excellent “opt‑in continuity.” Make autoplay a clear choice with value—“Play next with sound off + topic diversity”—and instrument those opt‑ins for ranking. Treat Brussels as a lab for “engagement without compulsion,” then export wins globally; waiting for courts risks a ~$12.06B headline (6% of FY2025 revenue) and, worse, months of frozen roadmaps while regulators draft your release notes. [3][4]

Sources

  1. EU demands Facebook and Instagram dismantle design features it calls addictive for users — AP News (https://apnews.com/article/facebook-instagram-eu-regulators-teens-addictive-b2f0ffd5ffc90721cacef7937e5909d2) — Straight report on July 10, 2026 findings, targeted features, and Meta’s “Teen Accounts.”

  2. Commission preliminarily finds the addictive design of Instagram and Facebook in breach of the Digital Services Act — European Commission (https://digital-strategy.ec.europa.eu/en/news/commission-preliminarily-finds-addictive-design-instagram-and-facebook-breach-digital-services-act) — Official description of infinite scroll, autoplay, push notifications, and requested default changes.

  3. The enforcement framework under the Digital Services Act — European Commission (https://digital-strategy.ec.europa.eu/en/policies/dsa-enforcement) — Legal basis for fines up to 6% of global annual turnover and the response process.

  4. Meta Reports Fourth Quarter and Full Year 2025 Results — Meta Investor Relations (https://investor.atmeta.com/investor-news/press-release-details/2026/Meta-Reports-Fourth-Quarter-and-Full-Year-2025-Results/default.aspx) — FY2025 revenue ($200.966B), ad impressions (+12% YoY), average price per ad (+9% YoY), and regulatory commentary.

  5. Commission opens proceedings against TikTok under the DSA regarding the launch of TikTok Lite in France and Spain — European Commission (https://digital-strategy.ec.europa.eu/en/news/commission-opens-proceedings-against-tiktok-under-dsa-regarding-launch-tiktok-lite-france-and-spain) — Precedent for rapid EU intervention and product suspension tied to “addictive” mechanics.

  6. Beyond the Headlines: Meta’s Record of Protecting Teens and Supporting Parents — Meta Newsroom (https://about.fb.com/news/2026/01/metas-record-protecting-teens-supporting-parents/amp/) — Meta’s description of teen safeguards, including nightly lockouts and a 15‑minute time cap option.

  7. Supervision of the designated very large online platforms and search engines under DSA — European Commission (https://digital-strategy.ec.europa.eu/en/policies/list-designated-vlops-and-vloses) — Confirms that Facebook and Instagram are designated VLOPs subject to enhanced DSA obligations.


Related update: We recently published an article that expands on this topic: read the latest post.

Fox-Roku Deal: Streaming Power Shift | Analysis by Brian Moineau

TL;DR

  • The Fox–Roku deal doesn’t just add content; it seizes the TV “home screen,” giving Fox bargaining power over discovery, data, and ad flows across tens of millions of U.S. living rooms. [2][5]
  • If DOJ lets Paramount–WBD close, David Ellison would consolidate two national newsrooms (CBS and CNN) while Fox consolidates distribution—an inverted barbell of power that squeezes everyone in the middle. [7][8]
  • Expect higher ad yields, tougher carriage terms for rival streamers, and regulatory flashpoints around “default bias” on Roku’s OS—the new choke point of the streaming wars. [3][5][7]

What the source said

Salon argues that Fox’s $22 billion acquisition of Roku and DOJ’s treatment of Ellison’s $111 billion bid to merge Paramount with Warner Bros. Discovery shift the fight from content to distribution power. [1][2][3][7][8]

The piece cites Pew’s 36% pay‑TV figure in 2025 as context for cord‑cutting, and points to Paramount’s refusal to air an advocacy ad as an example of consolidation’s real‑world effects. The thesis: control the pipe, shape the message. [4][16]

Why it matters

Two chokepoints are emerging in U.S. video in 2026. On one end, Fox buys Roku and, with it, the default interface and first‑party data that steer what Americans watch via Roku OS. On the other, Ellison’s Paramount–WBD deal would centralize CBS and CNN alongside major studios under a single balance sheet. [2][5][7][8]

Real stakeholders aren’t just “the audience.” They’re the streamers (Disney, Netflix, Amazon) that rent Roku’s shelf space; advertisers shifting budget into connected TV; and regulators (DOJ, FCC, state AGs) weighing whether TV‑OS defaults and self‑preferencing echo the Microsoft browser‑bundling fights in 2001. Local broadcasters, smaller FASTs, and publishers face worse negotiating power if they lack a gateway. [4][5][10]

Original analysis

The consensus take says “Fox bought Roku to bulk up streaming; Ellison’s Paramount–WBD is another mega‑merger.” That’s surface‑level. The deeper story is a pivot from programming to power over defaults on the TV home screen. That is exactly what Roku already sells—and what Fox just bought. [2][3][5]

In connected TV, defaults drive outcomes at scale. The company that sets the home screen, controls the search graph, and allocates promotional tiles determines which shows get sampled, which subscriptions renew, and which ad impressions clear. Those choices turn into revenue and bargaining power against every app on the platform. [2][5]

Historical analogue (what it predicts): United States v. Microsoft (2001) centered on bundling Internet Explorer into Windows to maintain OS power; courts upheld monopoly‑maintenance findings under Sherman Act §2 and scrutinized tying. Replace Windows with Roku OS and IE with house channels (Tubi, The Roku Channel), and the rhyme is obvious: default placement and self‑preferencing can foreclose rivals without banning them outright. Expect complainants to frame “home screen promos” and search ranking as a connected‑TV version of browser bundling. [7][10]

Back‑of‑envelope math (distribution economics):

  • Roku platform revenue in 2025 was roughly $4.15B; Roku guided high‑teens platform growth for 2026—assume +18% to ~$4.90B. [11][12][13][14]
  • If 70–80% of platform revenue is ad‑driven, apply +5% yield uplift from Fox‑controlled self‑preferencing to the midpoint (75%) of $4.90B: 0.75 × $4.90B = $3.675B ad base → +5% ≈ +$184M incremental annual ad revenue before partner concessions; even if half materializes, that’s ~$90M of low‑capex uplift tied to UI nudges. [11][12]
  • Share math: In Feb. 2026, The Roku Channel captured 2.9% of streaming viewership vs. Tubi at 2.2%; in ad‑supported streaming, Tubi ranked No. 1 at 6.2% in Q4 2025. If Fox diverts even one point of FAST discovery toward Tubi while IAB projects 2026 U.S. digital video at $80B+ (CTV a ~$20B slice), a 1‑point FAST share swing can translate into nine‑figure revenue depending on CPMs and sell‑through. Direction beats precision. [6][9][15][16]

A named typology: The TV Gatekeeper Matrix

  • Owned Content × Owned Distribution: Fox + Roku (Tubi, The Roku Channel inside Roku OS). Advantage: default bias, first‑party data, ad stack. Risk: antitrust scrutiny of self‑preferencing. [2][3][5]
  • Owned Content × Rented Distribution: Paramount–WBD (post‑deal) still reliant on third‑party platforms while building its own apps. Advantage: IP scale across CBS, CNN, and studios. Risk: platform tolls and discovery dependence. [7][8]
  • Rented Content × Owned Distribution: Samsung Tizen, LG webOS—OS control with thinner originals. Advantage: OEM reach into U.S. households. Risk: monetization frictions with app partners. [5]
  • Rented Content × Rented Distribution: Niche FASTs and SVODs living on others’ OSes. Advantage: focus. Risk: margin squeeze and limited shelf space.

Stakeholder breakdown (one‑liners):

  • Disney/Netflix/Amazon: Higher platform taxes and tougher placement negotiations on Roku; hedge with Samsung, LG, and Google TV distribution. [5]
  • NBCU/Peacock and YouTube: Near‑term winners—YouTube’s share lead holds across OSes; Peacock can still buy top‑shelf tiles but at rising prices. [6]
  • Samsung/LG: Counter with subsidized smart‑TV bundles and revenue‑share promos to pry apps from Roku‑centric funnels. [5]
  • Advertisers (P&G, GM, SMEs): Better cross‑screen targeting via Roku’s first‑party graph—if Fox preserves openness; CTV’s double‑digit growth in 2026 strengthens this pull. [13][15]
  • Regulators/State AGs: The case file writes itself: defaults, house‑channel boosting, and discovery throttling—citing Microsoft 2001 on page one. [10]

Contrarian read: The fear is Fox will blatantly stack the deck for Tubi and Fox News on Roku. My read: Fox will publicly preach “open platform” to keep Netflix, Disney, Amazon, and OEMs cooperative. The bias will creep in via subtle defaults—autoplay rows, search ranking, “continue watching” tiles, and cross‑app identity prompts that privilege Fox properties without visibly burying rivals. Those nudges are harder to litigate and more powerful commercially. [3][5][10]

What others are missing

The overlooked variable is ad‑tech plumbing, not just app placement. Roku controls native formats (home‑screen marquees, channel rails), measurement hooks, and self‑serve demand tools; Fox inherits those primitives and can bind them to Tubi’s inventory, sports shoulder‑programming, and news clips. Price those units as outcomes (site visits, app installs) instead of impressions, and the multiple expands. If Roku’s 2026 reporting split highlights double‑digit ad growth, Fox can ride a faster re‑rating because Wall Street values ad‑tech like software, not like TV. [11][13][14]

What to watch next

  1. By Q4 2026, at least one top‑5 streamer (YouTube, Netflix, Prime Video, Disney+, Max) publicly alleges or files comments about discriminatory placement or search treatment on Roku’s home screen.

  2. By Q2 2027, Fox integrates Tubi and The Roku Channel demand into a single ad‑buy surface with unified targeting and measurement, and discloses on an investor call a synergy run‑rate uplift of $100M+ tied to this integration. [11][14]

  3. By Q1 2027, a multistate AG coalition opens a probe into connected‑TV “default bias” and self‑preferencing on TV operating systems, naming Roku and at least one OEM OS as targets. [10]

My take

If you think the Fox–Roku deal is “about content,” you’re missing the real grab: owning the map—defaults, search, identity, and ad signal—on the living‑room OS in 2026. Per Nielsen’s Gauge reporting cited by Cord Cutters News, streaming’s share of viewing keeps rising, and IAB projects U.S. digital video ad spend to surpass $80B in 2026. Ellison’s roll‑up may grab headlines, but Fox just bought the steering wheel. I’d be long the gatekeepers and wary of any content company renting shelf space without an OS‑level fallback. [6][9][3][4][5][15]

Sources

  1. With Roku, Fox just won the streaming wars for the right — Salon (https://www.salon.com/2026/06/21/with-roku-fox-just-won-the-streaming-wars-for-the-right/) — The starting thesis that Fox’s Roku buy and Ellison’s bid are a shift from content to distribution.

  2. Fox Corporation to Acquire Roku, Inc. — Fox Corporation (https://www.foxcorporation.com/news/corp-press-releases/2026/fox-corporation-to-acquire-roku-inc/) — Confirms the $22B deal and states the “third‑largest by viewing share” claim.

  3. Fox to buy Roku for $22 billion — Axios (https://www.axios.com/2026/06/15/fox-roku-22-billion) — Independent confirmation of the deal terms and strategic framing.

  4. 83% of U.S. adults use streaming; only 36% subscribe to cable/satellite — Pew Research Center (https://www.pewresearch.org/short-reads/2025/07/01/83-of-us-adults-use-streaming-services-far-fewer-subscribe-to-cable-or-satellite-tv/) — Cord‑cutting baseline used in the analysis.

  5. Roku 28% and Samsung 23% of U.S. broadband‑household CTV usage — Parks Associates (press release) (https://www.prnewswire.com/news-releases/parks-associates-roku-28-and-samsung-23-dominate-connected-tv-platforms-controlling-access-to-streaming-audiences-in-the-us-market-302749732.html) — OS‑level market power data.

  6. The Roku Channel 2.9% vs. Tubi 2.2% of streaming in Feb. 2026 — Cord Cutters News (https://cordcuttersnews.com/the-roku-channel-is-the-most-watched-free-streaming-service-beating-tubi-pluto-tv-according-to-nielsen/) — Comparative FAST viewing shares cited from Nielsen’s Gauge.

  7. DOJ will “absolutely not” fast‑track Paramount–WBD for political reasons — Variety (https://au.variety.com/2026/film/news/doj-paramount-warner-bros-deal-review-fast-track-review-political-reasons-34449/) — Regulatory posture and ongoing scrutiny.

  8. U.S. clears Paramount’s $111B Warner Bros. takeover (report) — Moneycontrol (https://www.moneycontrol.com/world/us-clears-paramount-s-111-billion-warner-bros-takeover-article-13948430.html) — Report of DOJ clearance juxtaposed with continued reviews; shows contested status.

  9. IAB: U.S. digital video ad spend to surpass $80B in 2026 — IAB (https://www.iab.com/insights/video-ad-spend-report-2026/) — Ad‑market context underpinning the revenue math.

  10. Microsoft antitrust: Court of Appeals opinion (default bundling precedent) — U.S. DOJ (https://www.justice.gov/atr/cases/f204400/204468.htm) — The historical analogue for default‑driven platform power.

  11. Fellow Shareholders: 4Q25 letter — Roku (https://image.roku.com/bWFya2V0aW5n/4Q25-Shareholder-Letter.pdf) — Platform revenue of ~$4.15B and channel share commentary.

  12. Roku 10‑K and 8‑K excerpts on platform growth and home screen monetization — SEC (https://www.sec.gov/Archives/edgar/data/1428439/000162828026008114/roku-20251231.htm) — Definitions and revenue mix context.

  13. Roku Q1 2026 ad revenue split (reporting change) — MediaPost (https://www.mediapost.com/publications/article/414752/roku-q1-ad-spend-up-27-to-613m.html) — Ad‑revenue growth and disclosure useful for back‑of‑envelope math.

  14. Roku Q1 2026 earnings summary (third‑party extract) — StockTitan (https://www.stocktitan.net/sec-filings/ROKU/10-q-roku-inc-quarterly-earnings-report-05c5a40d6823.html) — Additional color on how platform revenue is earned.

  15. Tubi expands Nielsen deal; 6.2% of ad‑supported streaming in Q4 2025 — MediaPost (https://www.mediapost.com/publications/article/412569/tubi-expands-nielsen-deal-now-accounts-for-62-o.html) — FAST strength data for the revenue scenario.

  16. Paramount refused to air FPF’s ad critical of its merger — The Guardian (https://www.theguardian.com/us-news/2026/jun/16/paramount-rejects-ad-on-warner-bros-acquisition) — Concrete example of consolidation effects cited in the post.


Related update: We recently published an article that expands on this topic: read the latest post.



Related update: We recently published an article that expands on this topic: read the latest post.

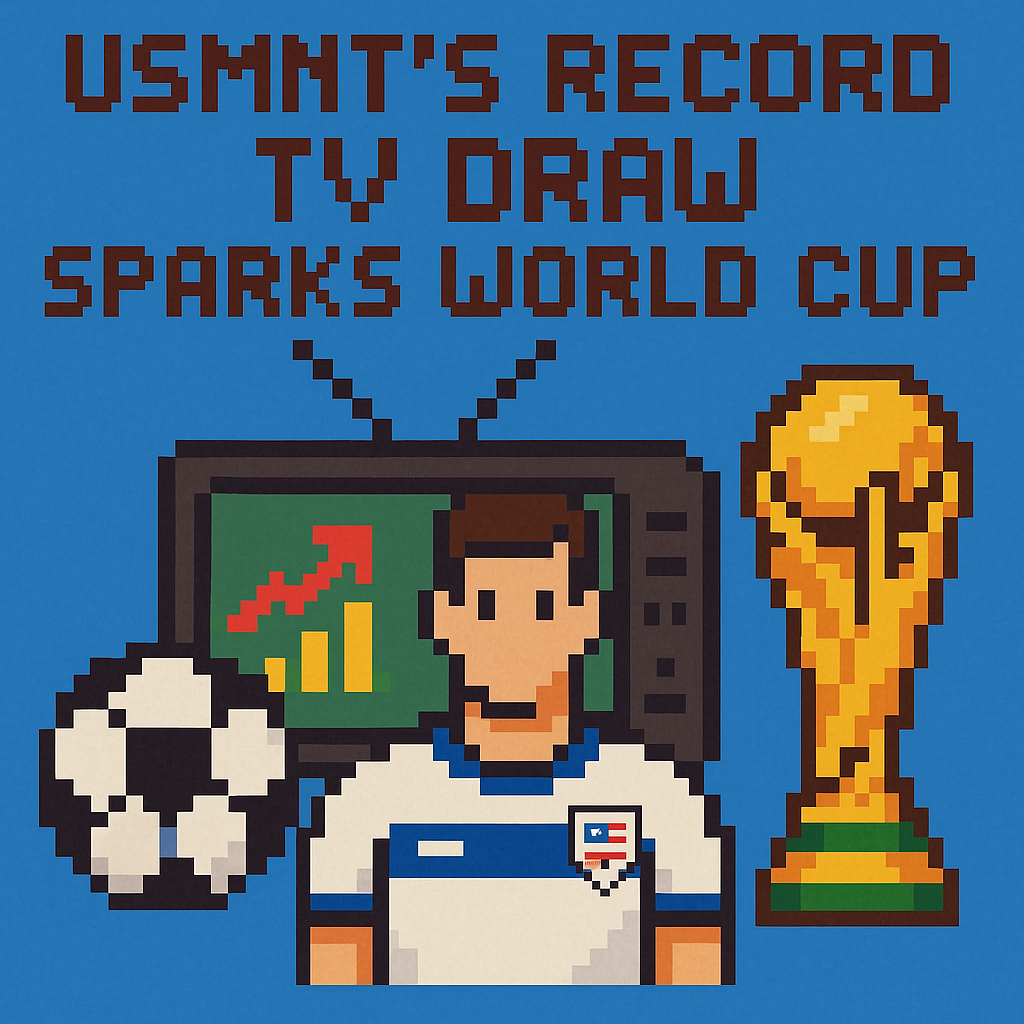
USMNTs Record TV Draw Sparks World Cup | Analysis by Brian Moineau

TL;DR

  • The USMNT’s World Cup 2026 opener against Paraguay set a new English‑language record telecast for the team, with Fox updating the average to 18.037 million and a 21.526 million peak measured between 10:45–11:00 p.m. ET—headline numbers that sit atop a changed Nielsen yardstick. [1]
  • The real story is bilingual scale: English plus Spanish averaged roughly 24.9 million on opening weekend—and if Fox’s 18.037 million update holds against Telemundo’s 8.9 million, the implied total hits about 26.9 million, which flirts with a new all‑time U.S. soccer record. [1][2][6][7]
  • Treat “record” with caution: out‑of‑home (OOH) viewing inclusion since 2020 and Big Data methodologies now juice totals, and telecast vs. match windows differ by network—making 2014 comparisons trickier than press releases admit. [1][2][3][4][8]

What the source said

Yahoo Sports reported that the USMNT’s 4–1 win over Paraguay at SoFi Stadium in Inglewood, California delivered the most‑watched USMNT telecast ever on English‑language TV. An initial average of 15.986 million across Fox, FS1, and Tubi was later revised to 18.037 million, with a peak of 21.526 million viewers between 10:45–11:00 p.m. ET on Friday night. [1]

Fox cited Nielsen’s hybrid “Big Data + panel” methodology, Adobe Analytics for digital, and Tubi’s internal logs, noting that OOH measurement can significantly increase totals versus pre‑2020 norms. Yahoo also highlighted a 132% jump versus the USMNT’s 7.763 million English‑language average in the 2022 opener vs. Wales, and pointed out that ESPN’s 2014 USA–Portugal audience used different counting rules—so multiple “records” can be true depending on definitions. [1][3][8]

Sports Media Watch added that Mexico–South Africa’s tournament opener set an English‑language group‑stage record of its own, framing a weekend of high demand across languages and dayparts in June 2026. [2][5]

Why it matters

This isn’t just a victory lap for Fox’s PR team in Los Angeles; it’s a stress test of the new U.S. sports‑TV “currency” in the hardest setting: bilingual audiences, hybrid linear‑streaming distribution, and a Nielsen system that blends panel data with device‑level Big Data and OOH viewing across 100% of U.S. TV households as of 2024. [4]

Stakeholders with real money on the line—Fox Sports and Tubi (ad sales and distribution), NBCUniversal’s Telemundo and Peacock (Spanish‑language primacy), brands aligning with U.S. Soccer (Volkswagen, Nike), and measurement providers (Nielsen)—stand to gain credibility or get pulled into a definitional fight about what “record” means in 2026. [2][4][5][9][10]

Original analysis

  • Contrarian read

    • Consensus: “Soccer has finally arrived—record audience proves it.”
    • My take: The “record” is partly methodological, and bilingual totals are the truer commercial signal in the United States. In 2014, ESPN’s USA–Portugal averaged 18.22 million on a single English‑language network without OOH counting; today’s “record” includes hybrid measurement, streaming, and OOH. Advertisers should benchmark against combined English+Spanish reach, not a single‑language crown. [2][3][4]
  • Back‑of‑envelope calculations

    1. Combined audience now vs. “implied” update
      • Reported combined average (fast nationals, opening weekend): Fox 15.986M + Telemundo 8.9M ≈ 24.886M. [2][6]
      • If Fox’s updated English‑language average is 18.037M and Spanish stays 8.9M, implied combined ≈ 26.937M (18.037 + 8.9). That would edge past the 2015 Women’s World Cup final’s 26.7M combined—America’s standing all‑time soccer audience mark. Caveat: Spanish‑language figures could also update. [1][7]
    2. Growth lens vs. 2022 (apples‑ish, but different slot and stakes)
      • 2022 USA–Wales (English) = 7.763M. A 132% lift implies ≈ 18.0M (7.763 × 2.32 ≈ 18.0), consistent with Fox’s 18.037M update. Prime‑time scheduling on Friday, the home‑nation halo, and OOH inclusion explain much of the jump. [1]
    3. Streaming’s slice
      • Tubi’s AMA ≈ 1.13M within the 15.986M initial English‑language average → ≈ 7.1% streaming share on Fox platforms during this match window. Even in a peak live‑sports moment, FAST/AVOD remained a minority slice. [2]
  • A 2×2: what really drives “records”

    • Axis 1: Measurement regime
      • Legacy panel (2014) vs. Hybrid Big Data + panel with OOH (2026).
    • Axis 2: Distribution structure
      • Single‑network monopoly (ESPN 2014) vs. Fragmented ecosystem (Fox broadcast + FS1 + Tubi; Telemundo + Peacock).
    • Quadrants
      • Legacy × Single (2014): Clean apples‑to‑apples, fewer counting disputes; ESPN’s USA–Portugal 18.22M stood tall but excluded OOH. [3]
      • Hybrid × Single: Hypothetical—not our reality now.
      • Legacy × Fragmented: Also hypothetical for World Cup.
      • Hybrid × Fragmented (2026): Today’s world—bigger totals, more caveats, and more press‑release “records” in parallel lanes (English vs. Spanish; linear vs. streaming) that make simple leaderboards misleading. [2][4]
  • Historical analogue: 2015 Women’s World Cup final (26.7M combined)
    The 2015 USA–Japan final drew 25.4M on Fox and roughly 1.3M on Telemundo, totaling 26.7M—still the U.S. soccer audience to beat in any year. That match rode a dominant U.S. team, a Sunday night slot in July 2015, and a simpler counting era. A USMNT knockout in a June–July 2026 primetime window could surpass that mark if bilingual averages hold near 27M. [7]

  • Named‑stakeholder breakdown

    • Fox Sports/Tubi: The “most‑watched USMNT English telecast” headline arms Fox sellers with a simple story, and quantifies Tubi’s live‑sports role at ≈1.13M AMA. Expect Fox to anchor sales on cross‑platform gross reach and bilingual packages through July 2026. [1][2]
    • Telemundo/Peacock (NBCU): Spanish‑language gravity is clear; Mexico–South Africa’s opener averaged about 12.1M on Telemundo, and the USMNT pulled about 8.9M in Spanish—evidence that bilingual packaging is the U.S. soccer superpower. [2][5][6]
    • Nielsen: The inclusion of OOH since 2020 and the hybrid Big Data + panel methodology—as expanded to 100% of U.S. TV households in 2024—are the core context behind “record” debates. Networks will keep choosing telecast windows that maximize their headline. [4][8]
    • U.S. Soccer and partners: Presenting sponsors and kit suppliers such as Volkswagen and Nike don’t buy “English‑only records”; they buy cultural scale and frequency across demos. Combined language reach—and proof of youth and Hispanic engagement—will shape post‑tournament pricing in 2026–2027. [9][10]

What others are missing

The buried angle: time‑slot engineering plus bilingual duplication reshapes the leaderboard more than any single number. Fox’s U.S. opener peaked around 10:45–11:00 p.m. ET on a Friday from SoFi Stadium, stacking West Coast casuals into the back half of primetime, while Telemundo’s surges for both the U.S. and Mexico matches hit in their own windows. The 2014 ESPN “record” sat in a European daylight slot and lacked OOH counting, so press‑release “records” today can be true yet non‑comparable. For brands, the operative KPI is combined, time‑specific reach and frequency across English, Spanish, and streaming, where the USMNT is already delivering mid‑20‑millions in June 2026. [1][2][3][5][6][8]

What to watch next

  1. By July 3, 2026, a USMNT knockout match played in a U.S. primetime window will surpass 30.0 million combined English+Spanish average viewers across Fox/FS1/Tubi and Telemundo/Peacock.
  2. By July 19, 2026, at least one USMNT match will deliver a Tubi average‑minute audience of 1.5 million or higher as Fox pushes incremental, free streaming reach in big windows. [2]
  3. By July 19, 2026, either Nielsen or a major outlet will publish a formal explainer reconciling 2014 vs. 2026 “record” claims (telecast vs. match window and OOH impact), prompting at least one network to adjust its phrasing in press materials. [4][8]

My take

Bilingual, prime‑time soccer has become a top‑five U.S. TV event template in 2026. If Fox’s 18.037 million English update and Telemundo’s 8.9 million Spanish figure both hold, the next USMNT primetime date should clear the 2015 mark of 26.7 million combined and keep going. That scale, not the single‑language crown, is what moves ad markets and corporate boardrooms in New York and Chicago. The play now is to sell combined reach, prove streaming lift, and make the bar‑and‑watch‑party OOH wave a feature, not a footnote. [1][2][6][7]

Sources

  1. Yahoo Sports — Report on USMNT–Paraguay opener ratings (June 2026), with Fox’s updated 18.037M English‑language average, 21.526M peak, and methodology context.
  2. Sports Media Watch — USMNT opener English and Spanish viewership marks, 15.986M initial English average, ~1.13M Tubi AMA, and hybrid/OOH measurement framing.
  3. ESPN Press Room — 2014 USA–Portugal averaged 18.22M (English only), establishing the pre‑OOH benchmark and offering 2014 context.
  4. Nielsen News — 2024 expansion of National OOH coverage to 100% of U.S. TV households, outlining Big Data + panel integration.
  5. The Washington Post — Mexico–South Africa World Cup opener set an English‑language group‑stage record, underscoring strong early demand.
  6. NBCUniversal/Telemundo Deportes Press — Opening‑weekend Spanish‑language audiences: USMNT ~8.9M and Mexico opener ~12.1M; Peacock simulcast context.
  7. Sports Media Watch — 2015 Women’s World Cup final (USA–Japan) combined 26.7M across English and Spanish, the all‑time U.S. soccer high.
  8. MediaPost — 2020 addition of out‑of‑home viewing into national TV ratings, explaining why post‑2020 figures run higher.
  9. U.S. Soccer Federation — Volkswagen presenting partnership since 2019 and activation objectives around U.S. national team windows.
  10. U.S. Soccer Federation — Nike kit deal and long‑term partnership extension announced in 2023, signaling sustained commercial alignment.


Related update: We recently published an article that expands on this topic: read the latest post.


Related update: We recently published an article that expands on this topic: read the latest post.


Related update: We recently published an article that expands on this topic: read the latest post.


Related update: We recently published an article that expands on this topic: read the latest post.

Analysts Lift Amazon Ahead of Q1 Earnings | Analysis by Brian Moineau

Why analysts are nudging Amazon higher ahead of Q1 earnings

Top Analysts Raise Amazon Stock (AMZN) Price Targets Ahead of Q1 Earnings – TipRanks has been the buzz line on desks this week, and for good reason. With Amazon scheduled to report first-quarter results on April 29, 2026, a string of influential research shops — including BMO, UBS, Bank of America and others — have nudged up price targets and refreshed their thinking on AWS, advertising and margin trajectory. (tipranks.com)

The timing matters. Expectations and price targets are shaping investor positioning right before a major earnings print, which can amplify market moves. Below I unpack what’s driving the optimism, what to watch in the Q1 release, and why the market’s reaction may hinge less on headlines and more on the tone of AWS growth and margin progress.

What analysts are saying and why it’s notable

  • Several top analysts raised price targets in recent weeks, citing stronger AWS momentum, improving free cash flow trends, and expanding ad monetization. These adjustments include moves from Bank of America, BMO and others that raised targets into the high-$200s and low-$300s. (tipranks.com)
  • TipRanks and other aggregator services show a consensus that remains skewed toward Buy/Outperform, with the average recent price target implying meaningful upside vs. spot. Analysts are increasingly valuing Amazon as a hybrid of retail, cloud (AWS) and advertising businesses, rather than a single-line retailer. (tipranks.com)

Why this is notable: large broker adjustments often reflect both fresh channel checks and updated multiples — sometimes driven by accelerating AI demand for cloud services. In Amazon’s case, investors are focusing on whether AWS’s revenue acceleration is structural, and whether retail margins are stabilizing.

The investor dilemma: expectations vs. execution

Two dynamics create tension for Q1:

  1. Expectations have crept higher. Greater confidence in AWS and ad growth has led analysts to lift models, which raises the bar for results. That’s good when the company delivers, and painful when it doesn’t. (tipranks.com)

  2. Execution noise remains real. Inventory shifts, promotional cadence, and one-off cost items can swing retail profitability quarter-to-quarter. Meanwhile, AWS growth — particularly if AI-driven demand persists — is the cleanest signal of durable operating leverage.

So, investors face a classic trade-off: lean into the narrative of a cloud-fueled re-rating, or treat the name as a still-volatile company where short-term beats or misses matter.

Pillars that could justify higher price targets

  • AWS acceleration. Analysts increasing targets point to evidence that AWS is regaining a higher growth multiple, driven by new AI workloads and infrastructure demand. If AWS posts sequential acceleration in revenue and improving margins, that provides the clearest justification for higher valuations. (tipranks.com)

  • Advertising and monetization. Amazon’s ad business remains under-monetized relative to digital peers. Continued expansion of DSP, Prime Video ad opportunities, and better cross-sell into retail could produce steady revenue lift without heavy capital intensity. (finance.yahoo.com)

  • Margin leverage and cash flow. Cost actions taken over the past year — including workforce adjustments and logistics optimization — may translate into margin and free cash flow improvements if demand stays healthy. Analysts note that even modest margin inflections can create large upside in price targets. (thestreet.com)

Near-term risks to keep on your radar

  • Guidance and tone. Management’s commentary about demand, pricing, and capital allocation will likely drive sentiment more than headline EPS. Defensive language or conservative guidance can undo positive momentum instantly.

  • Retail volatility. Retail remains sensitive to consumer spending cycles and promotional activity. A miss in retail margins or unexpected inventory write-downs would temper enthusiasm, even if AWS is strong. (tipranks.com)

  • Multiple compression. Even with AWS growth, broader multiple re-rating depends on sustained evidence of higher margins and cash returns. Market macro swings or multiple compression in tech could overwhelm company-level gains.

How I’d read the print on April 29, 2026

  • Focus on AWS growth rate and operating margin. A clear acceleration and margin expansion there is the single most market-moving item.

  • Watch guidance and management language. Are they talking about durable AI-driven demand, or one-off pockets of strength? Tone matters.

  • Check ad revenue cadence and retail margins. Together they reveal whether the diversification thesis is moving from narrative to numbers.

If AWS outperforms and management signals durable margin tailwinds, analysts’ higher price targets look prescient. If the report shows mixed AWS figures or defensive commentary, expect a reset in sentiment regardless of a near-term beat.

Market framing: why price-target moves matter

Analyst target changes ahead of an earnings event do three things:

  • They shift the narrative: upgrades send buyers looking for confirmation; downgrades trigger selling pressure.

  • They change positioning: institutional flows often track highest-conviction calls, so visible target hikes can draw fresh capital.

  • They create a higher bar: elevated targets increase the expectations that management must meet, intensifying post-earnings reactions.

That’s why even modest target increases — when issued by well-followed banks — can ripple through both retail and institutional trading desks. (tipranks.com)

A few quick takeaways

  • Analysts have raised AMZN price targets ahead of Q1 based largely on AWS strength and better margin visibility. (tipranks.com)
  • The Q1 print on April 29, 2026 will be read for AWS acceleration and management tone more than isolated retail beats. (tipranks.com)
  • Elevated targets raise the bar — good outcomes can drive a strong rally, but anything short of convincing AWS momentum could prompt a re-rating.

My take

Amazon sits at an inflection where cloud performance can eclipse retail quibbles. That doesn’t make it a sure winner in the next session, but it does mean the risk-reward heading into the April 29 report is more about narrative confirmation than baseline fundamentals. If you’re watching the print, prioritize AWS metrics and free-cash-flow signals over one-off retail noise.

Sources


Related update: We recently published an article that expands on this topic: read the latest post.


Related update: We recently published an article that expands on this topic: read the latest post.

Meta’s Resilience Cracks After Court | Analysis by Brian Moineau

When a Giant Stumbles: Meta Finally Shows Weakness and What It Means

The phrase Meta Finally Shows Weakness landed in my head the morning markets opened after two consecutive landmark legal losses. For years investors treated Meta’s stock like a rubber band: it could stretch through regulatory storms, advertising slowdowns, and costly bets on the metaverse — and then snap back. But a bad year caught up to that resilience, and now investors, policymakers, and the company itself face a new, less forgiving reality.

The core topic — Meta Finally Shows Weakness — isn’t just a headline. It’s the moment when legal pressure moved from a nagging background risk into a visible, quantifiable drag on the company’s prospects.

Why the recent losses matter

  • Juries in separate, high-profile trials found Meta liable or negligent in cases alleging harm to children and failures to protect users, producing multi-hundred-million dollar awards and renewed regulatory attention.
  • Those rulings arrived after a year of mixed signals: strong ad revenue and user growth on one hand, but rising legal costs, unsettled insurance coverage, and big strategic spending (Reality Labs, AI) on the other.
  • Markets hate uncertainty. When legal outcomes start to look less like one-off setbacks and more like systemic liabilities, investor sentiment can swing hard and fast.

Transitioning from reputation risk to balance-sheet consequences is what turns an operational challenge into a structural one. The recent verdicts pushed that transition.

The court defeats in plain terms

Recent jury decisions — including a New Mexico verdict ordering Meta to pay roughly $375 million and a separate California bellwether finding against Meta and YouTube for negligent design that harmed a plaintiff — have turned up the volume on a long-running wave of litigation alleging that social platforms harmed minors and misled users. These rulings matter not only for the dollar amounts but because they set precedent and embolden other plaintiffs and states.

At the same time, other legal fronts remain active: appeals, a revived advertisers’ class action, and regulatory probes in the U.S. and EU. A loss in a handful of trials doesn’t bankrupt Meta, but it raises the probability of more settlements, higher compliance costs, and stricter rules that could change business choices around product design and advertising.

How investors had been willing to look the other way

For much of the last two years, investors gave Meta the benefit of the doubt. Reasons included:

  • A powerful advertising engine that continued to grow revenue despite macro volatility.
  • Strong user engagement and product improvements tied to AI and Reels-style short video formats.
  • Confidence that management could absorb fines and legal costs while still delivering free cash flow.

That tolerance came with an implicit assumption: legal and regulatory issues were manageable, episodic, and unlikely to materially constrain growth. Recent rulings puncture that assumption.

The investor dilemma

Investors now face three hard questions:

  1. How much of Meta’s future cash flow is at risk from litigation and regulation?
  2. Will rising legal costs and potential design changes erode the ad targeting that underpins revenue?
  3. Is the company’s pivot to AI and hardware enough to justify the current valuation if regulatory headwinds tighten?

Answers differ based on risk appetite. Growth investors might still prize Meta’s monetization engine and discounted long-term AI bet. Value and risk-focused investors will demand higher margins of safety, citing amplified legal exposure and the possibility of regulatory measures that limit targeted ads or force design changes that reduce engagement.

What regulators and lawmakers are watching next

Momentum from jury verdicts breeds attention on Capitol Hill and in statehouses. Legislators who have long pushed for platform accountability now have fresh political cover to pursue laws addressing algorithmic design, child protection, or advertising transparency. For Meta, that means legal risk now comes alongside the real risk of structural, policy-driven changes to the business model.

Regulatory action could take many shapes: fines, design mandates, or restrictions on data-driven advertising. Each carries different financial and operational costs, but together they add a layer of uncertainty investors can’t ignore.

The company’s possible responses

Meta has several levers it can pull:

  • Appeal aggressively and fight precedent-setting rulings to limit contagion.
  • Increase spending on compliance, safety design, and product changes to reduce future liabilities.
  • Shift product and ad strategies to reduce reliance on controversial targeting methods.
  • Lean into new growth engines (AI-driven features, hardware) to diversify revenue.

None of these are cheap. Appeals can be lengthy; product redesigns can depress engagement; new growth initiatives require capital and time. The question for markets is whether Meta can absorb those costs without compromising its core profit engine.

A few practical takeaways for investors

  • Expect volatility. Legal verdicts and related headlines will drive short-term swings.
  • Watch regulatory signals closely — bills, FTC actions, and state attorney general moves can alter risk calculus.
  • Reassess valuation assumptions: factor in higher potential costs for litigation, compliance, and product redesign.
  • Diversify exposures across ad-driven tech names to avoid concentrated betting on a single regulatory outcome.

My take

Meta has shown it can recover from shocks before, but resilience isn’t infinite. When court losses stop being isolated and start looking systemic, the market’s tolerance thins. That’s the crux of why Meta Finally Shows Weakness matters: it signals a potential inflection point where legal and policy risk bite into valuation in a way that past earnings beats did not fully offset.

Meta remains a massive, profitable company with enviable assets. But investors and policymakers are now recalibrating: strong results won’t automatically trump structural risks. For those watching — whether as shareholders, regulators, or users — the coming months will reveal whether these legal defeats are a temporary bruising or the beginning of a longer, costly adjustment.

Final thoughts

Big companies often survive big problems, yet not all recoveries are equal. Meta’s path forward will come down to legal outcomes, regulatory responses, and how effectively the company adapts product and monetization strategies. The market’s verdict — swift and sometimes unforgiving — will reflect not only earnings and growth but how credible Meta’s plan looks for a world increasingly focused on safety, transparency, and regulation.

Sources


Related update: We recently published an article that expands on this topic: read the latest post.


Related update: We recently published an article that expands on this topic: read the latest post.